|
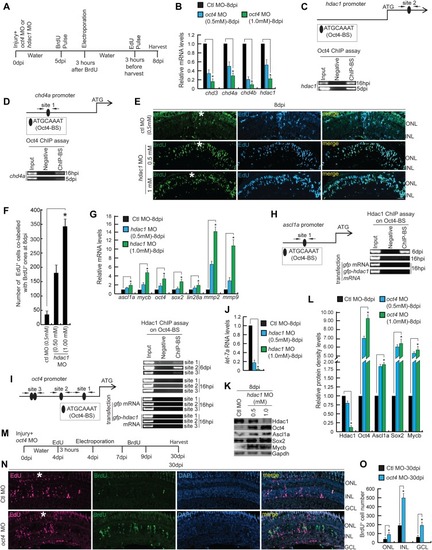
Effect of late <italic>hdac1</italic> and <italic>oct4</italic> knockdowns on MGPCs and gene expressions.(A) An experimental timeline that describes the injury, MO injection, BrdU pulse, late electroporation of the retina, and EdU pulse 3 h before harvest at 8 dpi. (B) qRT-PCR analysis of NuRD complex component genes’ mRNA levels in late oct4 knockdown retina, at 8 dpi. (C, D) The hdac1 (C) and chd4a (D) promoter schematics reveal the typical Oct4-BSs (upper) and the retinal ChIP assays confirm the physical binding of Oct4 at these sites (lower), in 16 hpi and 5 dpi retina. (E, F) IF confocal microscopy images of retinal cross sections show increased BrdU+ MGPCs at 8 dpi in hdac1 knockdown from fifth day onwards and the delay in exiting cell cycle as revealed by EdU co-labeling with BrdU+ MGPCs (E), which is quantified (F). (G) qRT-PCR analysis of ascl1a, mycb, oct4, sox2, lin28a, mmp2, and mmp9 mRNA levels in late hdac1 knockdown retina, at 8 dpi. (H, I) The ascl1a (H) and oct4 (I) promoter schematics reveal the typical Oct4-BS (upper) and the retinal ChIP assays confirm the physical binding of Hdac1 at the Oct4-BS (lower) in 6 dpi retina. The ChIP assay performed in 16 hpi retina and also in hdac1-overexpressed condition reveal no binding of Hdac1 at Oct4-BS of ascl1a (H, right) and oct4 (I, right) promoters. The gfp mRNA transfection is the control. (J) The qRT-PCR analysis shows decreased let-7a miRNA levels with late hdac1 knockdown at 8 dpi. (K, L) Western blot analysis of different regeneration-associated factors in late hdac1 knockdown retina at 8 dpi, which is quantified by densitometry (L). Gapdh is used as the loading control. (M) An experimental timeline that describes the injury, MO injection, EdU pulse, and late electroporation of the retina at 4 dpi and BrdU on 7–9 dpi before harvest at 30 dpi. (N, O) IF confocal microscopy images of retinal cross sections show EdU and BrdU-labeled MGPCs in oct4 knockdown from the fourth day onwards and the localization of the BrdU-labeled MGPCs to various retinal layers at 30 dpi (N), which is quantified (O). Ctl MO is control MO. Error bars are SD. (E, N) Scale bars, 10 μm; the asterisk marks the injury site; GCL, ganglion cell layer; INL, inner nuclear layer; ONL, outer nuclear layer (E, N).
|