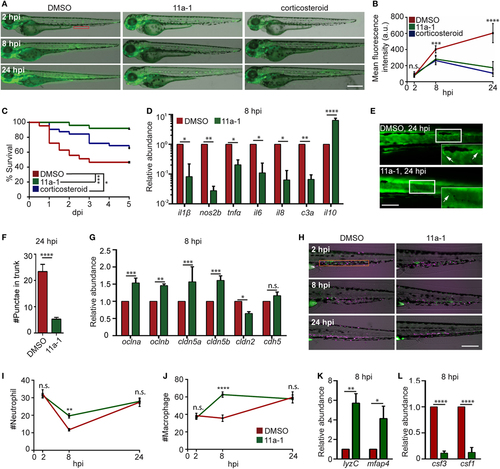
Shp2 inhibitor reduces lipopolysaccharide (LPS)-induced systemic inflammation and mortality. (A,B) Zebra fish embryos of Tg(NF:κB:GFP) were treated with DMSO, Shp2 inhibitor (11a-1), or corticosteroids and injected with LPS. Representative images (A) and quantification (B) of the GFP intensity in the indicated region. Scale bar: 500 µm. Results are presented as mean ± SD (D) (n = 3 independent experiments with over 20 larvae each/experiment). ***p < 0.001, ****p < 0.0001, Kruskal–Wallis test. (C) Survival curve LPS-injected larvae treated with DMSO, 11a-1, or corticosteroid. One representative experiment of three independent biological repeats (n = 20 each group) is shown. *p < 0.05, ***p < 0.001, Gehan–Breslow–Wilcoxon test. (D) Transcript levels of genes encoding pro-inflammatory and anti-inflammatory cytokines in whole larvae treated with DMSO or 11a-1 at 8 hpi. Results were normalized with ef1α and are presented as means ± SD (n = 3 biological repeats with 20 larvae in each group). *p < 0.05, **p < 0.01, ****p < 0.0001, Sidak’s multiple comparisons test. (E,F) Tg(β-actin:secANV-YFP)pu17 were treated with DMSO or 11a-1 and injected with LPS. Representative image (E) and quantification (F) of apoptotic cell puncta in the trunk. Scale bar: 200 µm. ****p < 0.0001, Mann–Whitney test. (G) Transcript levels of genes encoding vascular and cell junction proteins in whole larvae at 8 h post LPS injection treated with DMSO or 11a-1. Results were normalized with ef1α and are presented as means ± SD (n = 3 biological repeats with 20 larvae in each group). **p < 0.01, ***p < 0.001, Sidak’s multiple comparisons test. (H–J) Tg(mpeg:H2B-GFP) were crossed with Tg(mpx:mCherry), treated with DMSO or 11a-1 and injected with LPS. Representative images (H) and quantification of neutrophil (I) and macrophage (J) numbers in the caudal hematopoietic tissue (orange box). One representative result of three independent experiments was shown (n = 20). Scale bar: 200 µm. Results are presented as mean ± SD (n = 3 independent experiments with over 20 larvae each/experiment). **p < 0.01, ****p < 0.0001, Mann–Whitney test. (K,L) Transcript levels of genes encoding lyzC and mfap4 (K), csf3 and csf1 (L) in whole larvae treated with DMSO or 11a-1 after LPS injection. Results were normalized with ef1α and are presented as means ± SD (n = 3 biological repeats with 20 larvae in each group). *p < 0.05, **p < 0.01, ****p < 0.0001, Mann–Whitney test.
|
