
Fig. 1
- ID
- ZDB-FIG-180710-3
- Publication
- Hsu et al., 2018 - Development and Characterization of an Endotoxemia Model in Zebra Fish
- Other Figures
- All Figure Page
- Back to All Figure Page
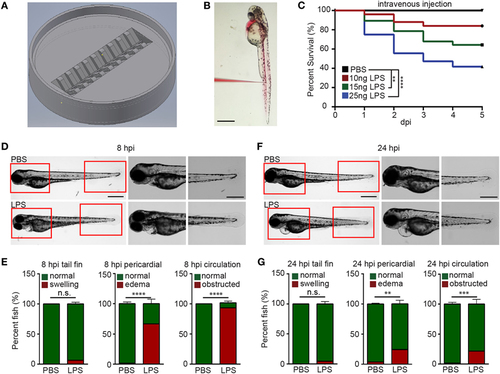
Zebra fish intravenous (IV) injection plate design and IV lipopolysaccharide (LPS) injection. (A) Illustration of the zebra fish IV injection plate. (B) A representative image of zebra fish larvae at 3 days post fertilization injected with PBS containing 1% Phenol Red. Scale bar: 500 µm. (C) Survival curve of zebra fish after PBS or 10, 15, and 25 ng LPS IV injection. One representative experiment of three independent biological repeats (n > 20 each group) is shown. **p < 0.01, ****p < 0.0001, Gehan–Breslow–Wilcoxon test. (D) Representative images of zebra fish larvae injected with PBS or LPS at 8 hours post injection (hpi). Scale bar: 500 µm. Boxed regions of the pericardium and tail fin are enlarged. Scale bar: 200 µm. Images representative of three independent experiments are shown (n = 20). (E) Percentage of fish with tail fin edema, pericardial edema, and circulation obstruction in PBS- or LPS-injected larvae at 8 hpi. Results are presented as mean ± SD (n = 3 independent experiments with over 20 larvae each/experiment). ***p < 0.001, ****p < 0.0001, Mann–Whitney test. (F,G) Representative images and quantification of inflammatory phenotypes in LPS- or PBS-injected larvae as (D,E) at 24 hpi. |
| Fish: | |
|---|---|
| Condition: | |
| Observed In: | |
| Stage: | Protruding-mouth |