
Fig. 4
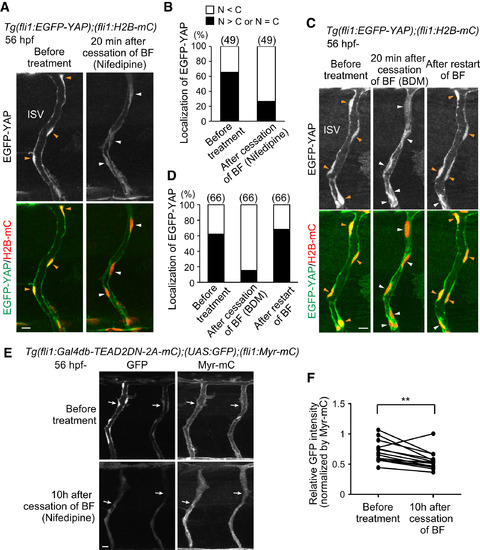
Blood Flow Regulates Yap1 Localization (A) Time-sequential confocal images of Tg(fli1:EGFP-YAP);(fli1:H2B-mC) embryos before treatment (56 hpf) and 20 min after cessation of blood flow (BF) by nifedipine treatment. EGFP-YAP was translocated from the nucleus (orange arrowheads) to the cytoplasm (white arrowheads) after cessation of BF. (B) Graph shows percentage of the number of the ECs in which EGFP-YAP is excluded from the nucleus (N < C, white bars) and those in which EGFP-YAP is localized in the nucleus (N > C or N = C, black bars) among the total number of observed ECs (indicated at the top) in ISVs of Tg(fli1:EGFP-YAP);(fli1:H2B-mC) embryos before treatment (56 hpf) and 20–30 min after cessation of BF by nifedipine. (C) Similarly to (A), the images of the embryo before treatment, 20 min after cessation of BF by 3-butanedione monoxime (BDM) treatment, and 2 hr after restart of BF by washing out BDM. EGFP-YAP was translocated from the nucleus (orange arrowheads) to the cytoplasm (white arrowheads) after cessation of BF and relocated to the nucleus (orange arrowheads) after the restart of BF. (D) Similarly to (B), the number of the ECs having EGFP-YAP in the nucleus or cytoplasm was quantified before and after the treatment with BDM as indicated at the bottom. (E) Projection of confocal stack fluorescence images of the ISVs in Tg(fli1:Gal4db-TEAD2ΔN-2A-mC);(UAS:GFP);(fli1:Myr-mC) embryos at 56 hpf (before treatment) and 10 hr after cessation of BF by nifedipine treatment. GFP images (left) and Myr-mC images (right) are shown. To avoid the bleaching of the fluorescent protein, we performed confocal imaging at two time points (before treatment and 10 hr after) with minimum laser power using the GaAsP detector. Arrows indicate GFP-positive ECs. (F) Fluorescent intensities of GFP in individual ISVs were quantified before treatment and 10 hr after cessation of BF by nifedipine, as observed in (E). The intensity of GFP in ECs was normalized by that of mCherry (see STAR Methods). Fifteen ISVs of three embryos were analyzed. ∗∗p < 0.01. Scale bars, 10 μm. See also Figure S4. |
| Genes: | |
|---|---|
| Fish: | |
| Conditions: | |
| Anatomical Terms: | |
| Stage: | Long-pec |
| Fish: | |
|---|---|
| Conditions: | |
| Observed In: | |
| Stage: | Long-pec |
Reprinted from Developmental Cell, 40, Nakajima, H., Yamamoto, K., Agarwala, S., Terai, K., Fukui, H., Fukuhara, S., Ando, K., Miyazaki, T., Yokota, Y., Schmelzer, E., Belting, H.G., Affolter, M., Lecaudey, V., Mochizuki, N., Flow-Dependent Endothelial YAP Regulation Contributes to Vessel Maintenance, 523-536.e6, Copyright (2017) with permission from Elsevier. Full text @ Dev. Cell