
Fig. S7
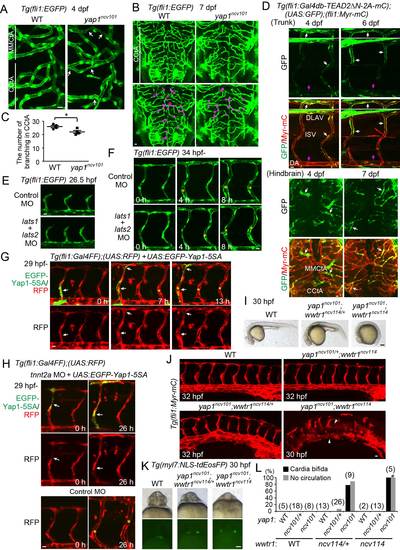
Loss-of-function and gain-of-function phenotypes of Yap1 and Wwtr1 in cardiovascular development, Related to Figure 7. (A) Projection of confocal stack fluorescence images of the hindbrain in Tg(fli1:EGFP) larvae with WT (left) and yapncv101 allele (right) at 4 dpf. Dorsal view, anterior to the top. Arrows indicate deformed blood vessels. (B) Projection of confocal stack fluorescence images of the hindbrain in Tg(fli1:EGFP) larvae with WT (left) and yapncv101 allele (right) fixed at 7 dpf. Dorsal view. Circles indicate the branching in the CCtA. (C) Quantification of the number of branching in the CCtA of Tg(fli1:EGFP) WT (left) and homozygous yap1ncv101 mutant larvae fixed at 7 dpf as in (B). Each dot represents the number for an embryo. Horizontal lines represent mean ± s.d. (n = 4). Note that the number of CCtA branching is significantly decreased in the mutant larvae. (D) Projection of confocal stack fluorescence images of the trunk (upper) and hindbrain (lower) regions in Tg(fli1:Gal4db-TEAD2ΔN-2A-mC);(UAS:GFP);(fli1:Myr-mC) larvae at 4, 6, and 7 dpf. Upper, GFP images (green); lower, the merged images (GFP, green; Myr-mC, red). Note that while GFP expression is kept high in 4-6 dpf in the DLAVs, ISVs, CCtA, and MMCtA (white arrows), it is attenuated in the DA (magenta arrows). Representative images of 11 (trunk) and 7 (hindbrain) larvae are shown. (E) Projection of confocal stack fluorescence images of the trunk region in Tg(fli1:EGFP) embryos (26.5 hpf) injected with control MO (left) or lats1 and lats2 double MOs (right). Note that ISV sprouting from the DA is not affected by the injection of the lats1 and lats2 double MOs. Representative images of 7 (control MO) and 8 (lats1 and lats2 double MOs) embryos from 2 independent experiments are shown. (F) Time-lapse confocal imaging of the lumen formation in the ISVs of Tg(fli1:EGFP) embryos (from 34 hpf) injected with control MO (left) or lats1 and lats2 double MOs (right). Yellow asterisks indicate lumens connecting to the circulation. Note that timing of lumen formation is not affected by the injection of the lats1 and lats2 double MOs. Representative images of 9 embryos from 3 independent experiments are shown. (G) Time-lapse confocal imaging of the lumen formation in the ISVs of Tg(fli1:Gal4FF);(UAS:RFP) embryos (from 29 hpf) injected with UAS:EGFP-Yap1-5SA plasmid which drives the expression of EGFP-Yap1-5SA in ECs in a mosaic manner. Upper, the merged images (EGFP-Yap1-5SA, green; RFP, red); lower, RFP images (red). Arrows indicate an ISV expressing EGFP-Yap1-5SA. Note that lumen formation occurs normally even in the ISV expressing EGFP-Yap1-5SA. Representative images of 3 independent experiments are shown. (H) Time-sequential confocal images of Tg(fli1:Gal4FF);(UAS:RFP) embryos (from 29 hpf) injected with UAS:EGFP-Yap1-5SA plasmid, together with control MO or cardiac troponin T type 2a (tnnt2a) MO. Arrows indicate an ISV expressing EGFP-Yap1-5SA. Note that the lumen formation is blocked in the ISVs of tnnt2a morphants even in the presence of EGFP-Yap1-5SA. Representative images of 2 independent experiments are shown. (I) Bright-field images of WT (left), yap1ncv101;wwtr1ncv114/+ (middle); and yap1ncv101;wwtr1ncv114 (right) embryos at 30 hpf. Note that the yap1ncv101;wwtr1ncv114 embryos exhibit severe developmental defects. (J) Projection of confocal stack fluorescence images of the trunk in Tg(fli1:Myr-mC) WT (upper left), yap1ncv101/+;wwtr1ncv114 (upper right), yap1ncv101;wwtr1ncv114/+ (lower left), and yap1ncv101;wwtr1ncv114 (lower right) embryos at 30 or 32 hpf . Axial vessels were not formed in yap1ncv101;wwtr1ncv114 embryos (arrowheads). Representative images of 2 independent experiments are shown. (K) Stereomicroscopic images of Tg(myosin light polypeptide 7(myl7):NLS-tdEosFP) WT (left), yap1ncv101;wwtr1ncv114/+ (middle), and yap1ncv101;wwtr1ncv114 (right) embryos at 30 hpf. Ventral view. Upper, bright-field images; lower, tdEosFP images (green flourescnece). Note that yap1ncv101;wwtr1ncv114/+ and yap1ncv101;wwtr1ncv114 embryos exhibit cardia bifida. (L) Graph shows the percentage of the number of embryos showing cardia bifida (black) and no circulation (gray) among the yap1 and wwtr1 mutant (or WT) embryos. Total number of each group embryos are indicated at the top. The results were obtained from 2 independent experiments . Embryos from incrosses of heterozygous yap1ncv101/+;wwtr1ncv114/+ zebrafish were observed at 30 hpf to quantify cardia bifida as in (K) and at 2 dpf to check the circulation, and subsequently genotyped by genomic PCR. All yap1ncv101;wwtr1ncv114 embryos died until 32 hpf before the circulation (#). Scale bars, 10 µm in (A, B, D, E, F, G, H, and J), 100 µm in (I and K). *P < 0.05. |
Reprinted from Developmental Cell, 40, Nakajima, H., Yamamoto, K., Agarwala, S., Terai, K., Fukui, H., Fukuhara, S., Ando, K., Miyazaki, T., Yokota, Y., Schmelzer, E., Belting, H.G., Affolter, M., Lecaudey, V., Mochizuki, N., Flow-Dependent Endothelial YAP Regulation Contributes to Vessel Maintenance, 523-536.e6, Copyright (2017) with permission from Elsevier. Full text @ Dev. Cell