
Fig. 2
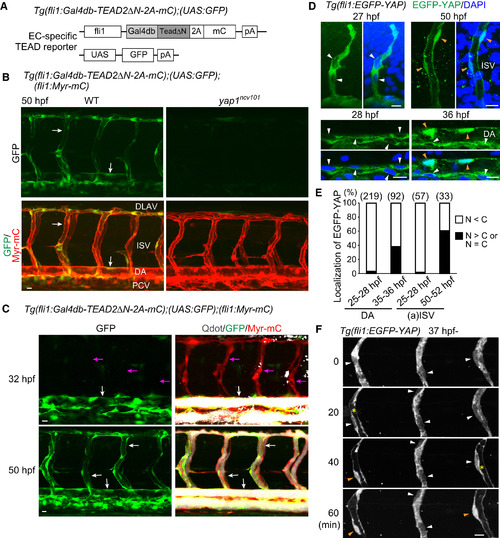
Yap1/TEAD-Dependent Transcription Becomes Active in Perfused Vessels (A) The constructs used to monitor Yap1 responses in EC by using fli1 promoter (EC-specific TEAD reporter). (B) Projection view of confocal stack fluorescence images of the trunk region in Tg(fli1:Gal4db-TEAD2ΔN-2A-mC);(UAS:GFP);(fli1:Myr-mC) WT (left) and homozygous yap1ncv101 mutant embryos (right) at 50 hpf. Lateral views, anterior to the left. Upper panels, GFP images (green); lower panels, merged images (GFP, green; Myr-mC, red). White arrows indicate GFP signal-positive ECs of lumenized blood vessels. Representative images of four independent experiments are shown. (C) Projection view of confocal images of the trunk region in Tg(fli1:Gal4db-TEAD2ΔN-2A-mC);(UAS:GFP);(fli1:Myr-mC) embryos (at 32 and 50 hpf as indicated at the left) injected with Qdot 655 (white) into the heart to visualize perfused vessels. Left, GFP images (green); right, merged images (Qdot 655, white; GFP, green; Myr-mC, red). While a significant population of ECs of perfused vessels expresses GFP (white arrows), ECs of non-perfused vessels do not (magenta arrows). (D) Projection view of confocal images of the trunk region of fixed Tg(fli1:EGFP-YAP) embryos (at 27–50 hpf as indicated at the top) immunostained with anti-GFP antibody (green) together with DAPI (blue). White and orange arrowheads indicate EGFP-YAP in the cytoplasm and nucleus, respectively. (E) Graph shows percentage of the number of the ECs in which EGFP-YAP is excluded from the nucleus (N < C, white bars) and those in which EGFP-YAP is localized in the nucleus (N > C or N = C, black bars) at the indicated stages of the dorsal aorta (DA) and the arterial intersomitic vessels (aISVs) among the total number of observed ECs (indicated at the top) from 7 to 10 embryos. (F) Time-sequential two-photon images of ISVs in Tg(fli1:EGFP-YAP) embryos that were about to form lumen (from 37 hpf). Elapsed time (min) is indicated at the left. Yellow asterisks indicate newly formed lumens connecting to the circulation. White and orange arrowheads indicate EGFP-YAP in the cytoplasm and nucleus, respectively. Representative images of seven independent experiments are shown. Scale bars, 10 μm. See also Figure S2.. |
| Genes: | |
|---|---|
| Fish: | |
| Anatomical Terms: | |
| Stage Range: | Prim-5 to Long-pec |
| Fish: | |
|---|---|
| Observed In: | |
| Stage: | Long-pec |
Reprinted from Developmental Cell, 40, Nakajima, H., Yamamoto, K., Agarwala, S., Terai, K., Fukui, H., Fukuhara, S., Ando, K., Miyazaki, T., Yokota, Y., Schmelzer, E., Belting, H.G., Affolter, M., Lecaudey, V., Mochizuki, N., Flow-Dependent Endothelial YAP Regulation Contributes to Vessel Maintenance, 523-536.e6, Copyright (2017) with permission from Elsevier. Full text @ Dev. Cell