
Fig. 3
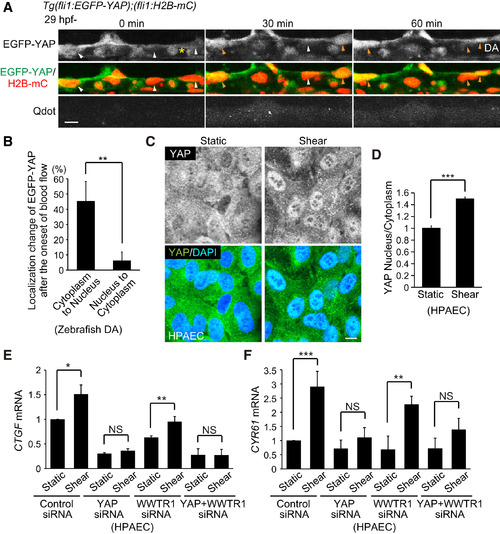
Flow Induces Nuclear Translocation of YAP (A) Time-lapse confocal imaging of the onset of the circulation in the DA of Tg(fli1:EGFP-YAP);(fli1:H2B-mC) embryos (from 29 hpf). To visualize the circulation, we injected Qdot 655 (white) into the heart just before imaging. Yellow asterisks indicate lumen in the DA. Elapsed time (min) is indicated at the top. White and orange arrowheads indicate EGFP-YAP (green) in the cytoplasm and nucleus, respectively. H2B, histone H2B. (B) Percentage of ECs in the DA in which EGFP-YAP translocated from “cytoplasm to nuclei” or from “nuclei to cytoplasm” just after the circulation. Localization change was examined between 20 and 30 min before the onset of the circulation and 20–30 min after the onset of the circulation visualized by Qdot 655 as in (A). Data obtained from at least ten cells of single DA of three embryos are expressed as mean ± SD. (C) Human pulmonary artery endothelial cells (HPAECs) cultured at high density (1,000–1,500 cells/mm2) under static conditions or after laminar shear stress at 15 dynes/cm2 for 10 min were fixed and immunostained with anti-YAP antibody together with DAPI. YAP images and the merged images (YAP, green; DAPI, blue) are shown. (D) Quantification of nuclear relative to cytoplasmic fluorescent intensity of YAP in static or sheared HPAECs examined in (C). Data are mean ± SD (n = 3 independent experiments, in each of which >150 cells were measured). (E and F) HPAECs transfected with control siRNA, YAP siRNA, WWTR1 siRNA, or YAP + WWTR1 siRNAs were kept under static conditions or subjected to shear stress at 15 dynes/cm2 for 30 min. Relative expression levels of CTGF mRNA (E) and CYR61 mRNA (F) were analyzed by qPCR analyses. Data are normalized to the values in static control siRNA-transfected ECs. Data are mean ± SD (n ≥ 3 independent experiments). ∗p < 0.05, ∗∗p < 0.01, ∗∗∗p < 0.001; NS, not significant. Scale bars, 10 μm. See also Figure S3. |
| Genes: | |
|---|---|
| Fish: | |
| Anatomical Term: | |
| Stage: | Prim-5 |
Reprinted from Developmental Cell, 40, Nakajima, H., Yamamoto, K., Agarwala, S., Terai, K., Fukui, H., Fukuhara, S., Ando, K., Miyazaki, T., Yokota, Y., Schmelzer, E., Belting, H.G., Affolter, M., Lecaudey, V., Mochizuki, N., Flow-Dependent Endothelial YAP Regulation Contributes to Vessel Maintenance, 523-536.e6, Copyright (2017) with permission from Elsevier. Full text @ Dev. Cell