
Fig. S4
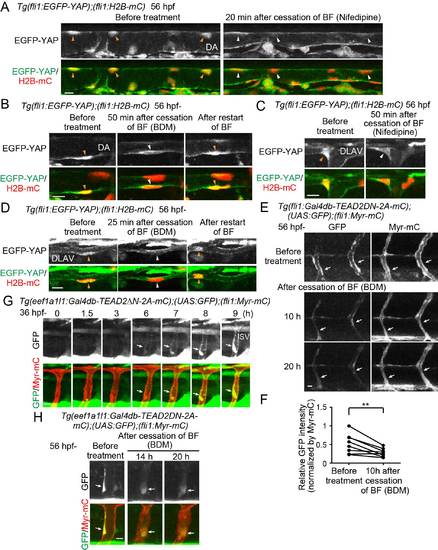
Blood flow-mediated regulation of Yap1, Related to Figure 4. (A) Time-sequential confocal stack fluorescence images of the DA in Tg(fli1:EGFP-YAP);(fli1:H2B-mC) embryos (at 56 hpf) before treatment and 20 min after cessation of blood flow (BF) by Nifedipine treatment. Note that EGFP-YAP is translocated from the nucleus marked by mCherry-tagged histone H2B (orange arrowheads) to the cytoplasm (white arrowheads) after cessation of BF. (B) Time-sequential confocal stack fluorescence images of the DA in Tg(fli1:EGFP-YAP);(fli1:H2B-mC) embryos before treatment, 50 min after cessation of BF by 3-Butanedione monoxime (BDM) treatment, and 2 h after restart of BF by washing out BDM. Note that EGFP-YAP relocated to the nucleus (orange arrowheads) after restart of BF. (C) Similarly to (A), the images of the DLAV in Tg(fli1:EGFP-YAP);(fli1:H2B-mC) embryos before treatment and 50 min after cessation of BF by Nifedipine treatment are shown. (D) Similarly to (B), the images of the DLAV in Tg(fli1:EGFP-YAP);(fli1:H2B-mC) embryos before treatment, 25 min after cessation of BF by BDM treatment, and 2 h after restart of BF by washing out BDM are shown. (E) Projection view of confocal stack fluorescence images of the ISVs in Tg(fli1:Gal4db-TEAD2ΔN-2A-mC);(UAS:GFP);(fli1:Myr-mC) embryos at 56 hpf (upper panels, before treatment) and those after cessation of BF by BDM treatment at the time point indicated at the left (lower panels) GFP images (left) and mC images (right) are shown. To avoid the bleaching of the fluorescent protein, confocal imaging was performed at limited time points (before treatment, 10 h, and 20 h after cessation of BF) as in Figure 4E. Arrows indicate GFP signal-positive ECs. (F) Fluorescent intensities of GFP in individual ISVs were quantified before treatment and 10 h after cessation of BF by BDM, as observed in (E). Relative intensity of GFP to that of Myr-mC was plotted (see STAR Methods). Total 8 ISVs of 3 embryos were analyzed. (G) Time sequential confocal stack images of ISV in Tg(eef1a1l1:Gal4db-TEAD2ΔN-2A-mC);(UAS:GFP);(fli1:Myr-mC) embryos (from 36 hpf). Elapsed time (h) is indicated at the top. An asterisk indicates newly formed lumen. Note that GFP expression in ISVs (arrows) is detected after lumen formation. Similar results were obtained in 4 independent experiments. (H) Projection view of confocal stack fluorescence images of the ISVs in Tg(eef1a1l1:Gal4db-TEAD2ΔN-2A-mC);(UAS:GFP);(fli1:Myr-mC) embryos at 56 hpf (left panels, before treatment) and those at the indicated time (center and right) after cessation of BF by BDM treatment. GFP images (upper) and the merged images (lower; GFP, green; Myr-mC, red) are shown. Note that GFP expression is reduced after cessation of blood flow (arrows). Similar results were obtained in 10 GFP signal-positive ISVs from 3 independent experiments. Scale bars, 10 µm. **P < 0.01. DA, dorsal aorta; DLAV, dorsal longitudinal anastomotic vessel; ISV, intersomitic vessel. |
Reprinted from Developmental Cell, 40, Nakajima, H., Yamamoto, K., Agarwala, S., Terai, K., Fukui, H., Fukuhara, S., Ando, K., Miyazaki, T., Yokota, Y., Schmelzer, E., Belting, H.G., Affolter, M., Lecaudey, V., Mochizuki, N., Flow-Dependent Endothelial YAP Regulation Contributes to Vessel Maintenance, 523-536.e6, Copyright (2017) with permission from Elsevier. Full text @ Dev. Cell