
Fig. 11
- ID
- ZDB-FIG-140324-43
- Publication
- Weber et al., 2013 - Characterization of light lesion paradigms and optical coherence tomography as tools to study adult retina regeneration in zebrafish
- Other Figures
- All Figure Page
- Back to All Figure Page
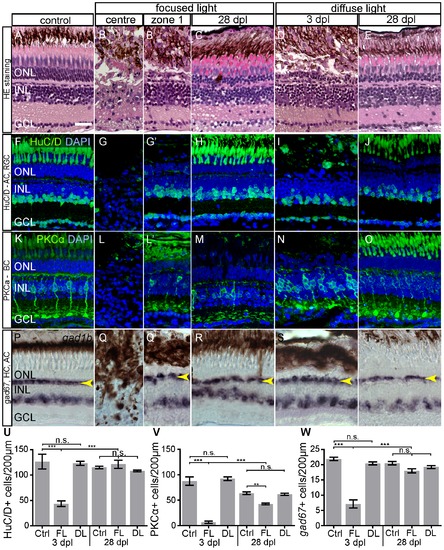
Morphology and Immunohistochemistry of neuronal cell types in light lesions at 3 and 28 dpl. A–E: Light lesioned retina morphology shown by hematoxylin/eosin staining. Severe damage to all laminae is found in the centre of focused light lesion zone 1 in an area of ~50 μm in diameter. F–J: HuC/D antibody staining labels nuclei of AC and RGC. K–O: Antibody-staining against Phospho-Kinase C α-subunit (PKCα) labels a subset of bipolar cells. P–T: HC and a subset of AC are labelled by gad1b in situ hybridization. The continuous line pattern of HC is indicated by the arrowhead. U–W: Quantification of inner retinal neurons. The bars indicate the number of marker+ cells in 200 μm length of the retina across the most severe lesion. As control served untreated eyes of focused light treated fish. Regeneration of all cell types was assessed at 28 dpl. Error bars indicate SEM; ***p<0.001; AC: amacrine cells, BC: bipolar cells; DL: diffuse light lesions; FL: focused light lesions; GCL: ganglion cell layer; HC: horizontal cells; INL: inner nuclear layer; PR: photoreceptor cells; RGC: retinal ganglion cells. Scale bar represents 20 μm. |