
Fig. 8
- ID
- ZDB-FIG-140324-40
- Publication
- Weber et al., 2013 - Characterization of light lesion paradigms and optical coherence tomography as tools to study adult retina regeneration in zebrafish
- Other Figures
- All Figure Page
- Back to All Figure Page
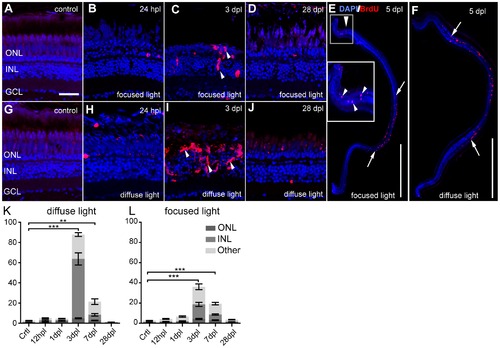
Proliferative response after light lesions. Proliferating cells are labelled by BrdU (red). A, G: Untreated control shows weak autofluorescence in photoreceptors. B–D: Clusters of BrdU+ cells are indicated by white arrowheads. E–F: Overview images showing proliferating cells at 5 dpl in the characteristic lesion areas (between arrows). G–J: Time course after a diffuse light lesion. K, L: Quantification of BrdU+ cells in the whole retina per cell layer normalized to 1 mm retinal length. Most proliferating cells are found in the INL and ONL at 3 dpl. BrdU+ cells found in the ganglion cell layer and the ciliary marginal zones are indicated as ‘Other’. Error bars indicate SEM. Scale bar represents 20 μm (A–D, G–J) or 500 μm (E, F). |