
Fig. 9
- ID
- ZDB-FIG-140324-41
- Publication
- Weber et al., 2013 - Characterization of light lesion paradigms and optical coherence tomography as tools to study adult retina regeneration in zebrafish
- Other Figures
- All Figure Page
- Back to All Figure Page
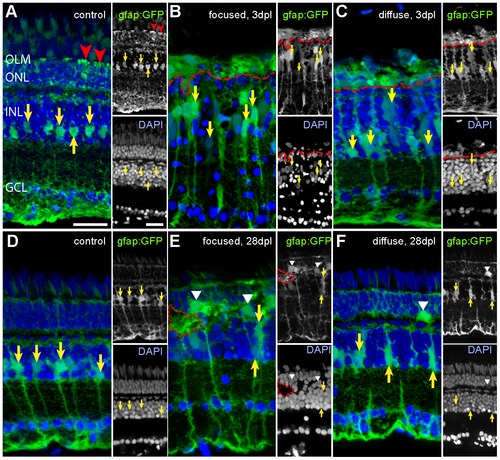
Müller glia cells after light lesions, labelled by the gfap:GFP reporter line (green) and DAPI (blue). Somata and processes of MG are indicated by yellow and red arrows, respectively. A: Untreated control retina. MG processes in the ONL are indicated by red arrowheads. B: 3 days after focused light lesion in the lesion centre. Swollen MG nuclei were found (yellow arrows). MG processes in the ONL collapsed (above dashed red line). C: 3 days after diffuse light lesions. ONL processes of MG collapsed (above dashed red line). D: Control side of focused light treated fish after 28 dpl. E: 28 days after focused light lesion in the lesion centre. Somata of MG are larger and sometimes displaced to the ONL (white arrowhead). Gaps in DAPI channel (dashed red line) are filled with GFP+ MG. F: 28 dpl after diffuse light lesion. Some displaced MG were found in the ONL (white arrowhead). |