
Fig. 6
- ID
- ZDB-FIG-140324-38
- Publication
- Weber et al., 2013 - Characterization of light lesion paradigms and optical coherence tomography as tools to study adult retina regeneration in zebrafish
- Other Figures
- All Figure Page
- Back to All Figure Page
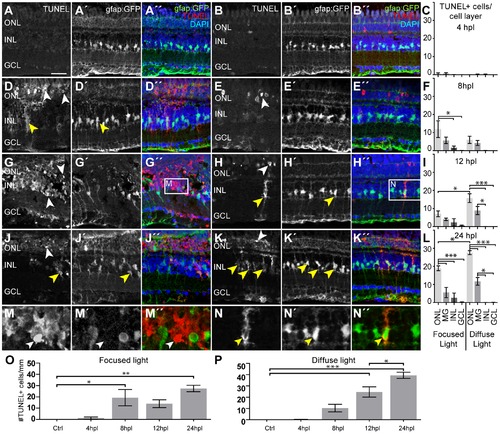
Cell death after light lesions in Tg(gfap:GFP) fish. TUNEL+ cells are labeled in red, MG are GFP+ (green), nuclei are stained with DAPI (blue). Quantification shows TUNEL+ cells per cell layer normalized to 1 mm retinal length in (C, F, I, L). GFP/TUNEL double positive cells are indicated as ‘MG’ to discriminate between phagocytic MG and real INL cell death. A–C: Only very few TUNEL+ cells were found early at 4 hpl. D–I: Increasing amounts of TUNEL+ cells were found between 8 hpl and 12 hpl (white arrowheads). The density of TUNEL+ cells is high in the center of focused light lesions but lower along the whole retina after diffuse light lesions. J–L: A peak of TUNEL+ cells is found at 24 hpl in both lesion paradigms. M: Many TUNEL+ INL cells that are GFP- (white arrowhead) were found in the centre of focused light lesions, but were rare elsewhere. N: Example of TUNEL+ MG. TUNEL+ signal is found in the cytoplasm (yellow arrowhead). O, P: Time course of the total number of TUNEL+ cells per mm peaking at 24hpl. dpl: days post lesion; GCL: ganglion cell layer; hpl: hours post lesion; INL: inner nuclear layer; MG: Müller glia; ONL: outer nuclear layer; Error bars indicate standard error of the mean; *** for p-values <0.001; ** for p-values <0.01; * for p<0.05; scale bars represent 20 μm. |