
- Title
-
Glia maturation factor-β in hepatocytes enhances liver regeneration and mitigates steatosis and ballooning in zebrafish
- Authors
- Li, H.Y., Zeng, W.L., Ye, Y.W., Chen, X., Zhang, M.M., Chen, Y.S., Liu, C.T., Zhong, Z.Q., Li, J., Wang, Y.
- Source
- Full text @ Am. J. Physiol. Gastrointest. Liver Physiol.
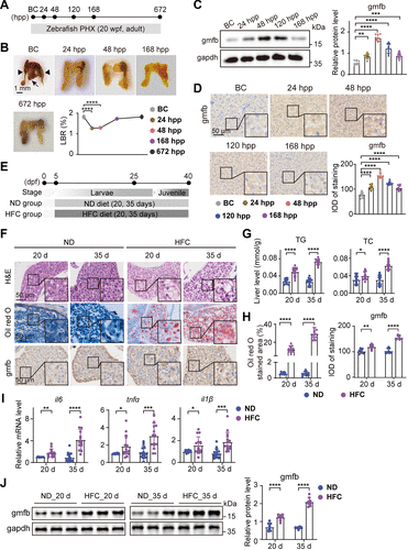
Gmfb expression in liver following PHX or in MASLD. A and E: schematic illustration of the construction of zebrafish PHX and MASLD models. B: representative liver images and the change of LBR of WT zebrafish at indicated timepoints after PHX. In BC panel, the black arrowheads indicate the two lateral lobes, the black arrow indicates the ventral lobe, and the red short, dashed line indicates the PHX incision site. Scale bar = 1 mm. n = 8 fish per timepoint. One-way ANOVA, ****P < 0.0001 vs. BC group. C: protein expression levels of gmfb and gapdh as normalization control in the liver of WT zebrafish at indicated timepoints after PHx. n = 8 fish per group. Data were presented as relative expression levels. One-way ANOVA, **P < 0.01, ***P < 0.001, ****P < 0.0001 vs. BC group. D: representative anti-gmfb immunochemical images in liver slices from WT zebrafish at indicated timepoints after PHX and quantification of gmfb-positive staining density in the images. Scale bar = 50 μm. n = 8 fish per group. One-way ANOVA, ****P < 0.0001 vs. BC group. F: representative H&E, oil red O, and anti-gmfb immunochemical staining images in zebrafish liver slices from ND and HFC groups. Scale bar = 50 μm. n = 12 samples for H&E and oil red O staining, n = 8 samples for immunochemical staining, one fish per sample. G: levels of TG and TC in liver samples of WT zebrafish at 20 d and 35 d from ND and HFC groups. n = 15 samples per group, 10 fish per sample. Two-tailed t test, *P < 0.05, ****P < 0.0001 vs. ND group. H: quantification of positive areas for lipid droplets stained with oil red O and the gmfb-positive staining density, respectively in F. Two-tailed t test, **P < 0.01, ****P < 0.0001 vs. ND group. I and J: expression levels of il6, tnfα, and il1β mRNAs (I) and gmfb and gapdh (normalization control) proteins (J) in liver samples of zebrafish at 20 d and 35 d from ND and HFC groups. n = 15 samples per group (I), n = 8 samples per group (J), 10 fish per sample. Data were presented as relative expression levels. Two-tailed t test, *P < 0.05, **P < 0.01, ***P < 0.001, ****P < 0.0001 vs. ND group. All experiments were repeated on at least 3 clutches. BC, baseline control; d, days; dpf, days post fertilization; gapdh, glyceraldehyde-3-phosphate dehydrogenase; gmfb, glia maturation factor-β; H&E, hematoxylin and eosin; HFC, high fat, high cholesterol diet; hpp, hours post PHX; il1β, interleukin 1 beta; il6, interleukin 6; IOD, integral optical density; LBR, liver-to-body weight ratio; MASLD, metabolism-associated steatotic liver disease; ND, normal diet; PHX, partial hepatectomy; TC, total cholesterol, TG, triglycerides; tnfα, tumor necrosis factor alpha; wpf, weeks post fertilization; WT, wild-type. |
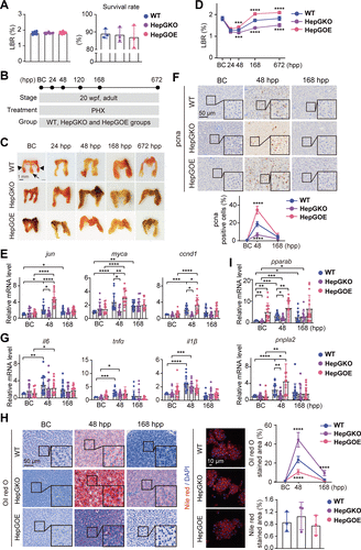
Hep-gmfb promotes liver regeneration and prevents hepatic steatosis post PHX. A: LBR and survival rate of zebrafish from WT, HepGKO, and HepGOE groups. For the LBR, n = 8 samples, one fish at 20 wpf per sample. For the survival rate analysis, n = 3 replicated groups, 100 fish at 5 dpf per group. B: schematic illustration of the construction of zebrafish PHX model with WT, HepGKO, and HepGOE lines. C: representative images of livers from WT, HepGKO, and HepGOE groups at indicated timepoints post-PHx. In BC panel, the black arrowheads indicate the two lateral lobes, the black arrow indicates the ventral lobe, and the red short, dashed line indicates the PHX incision site. Scale bar = 1 mm. n = 8 fish per group. D: LBR of zebrafish from WT, HepGKO, and HepGOE groups at indicated timepoints post-PHx. n = 8 fish per group. One-way ANOVA, ***P < 0.001, ****P < 0.0001 vs. WT group. E, G, and I: expression levels of indicated genes jun, myca, and ccnd1 in (E); il6, tnfα, and il1β in (G); and pparab and pnpla2 in (I) in liver samples from WT, HepGKO, and HepGOE groups at BC, 48 hpp and 168 hpp. n = 15 fish per group. Data were presented as relative expression levels. One-way ANOVA, *P < 0.05, **P < 0.01, ***P < 0.001, ****P < 0.0001 vs. BC or WT group. F: representative anti-pcna immunochemical images in liver sections and quantification of pcna positive staining cell from WT, HepGKO, and HepGOE groups at BC, 48 hpp and 168 hpp. Scale bar = 50 μm. n = 8 fish per group. One-way ANOVA, ****P < 0.0001 vs. WT group. H: representative images of lipid droplets with oil red O staining in liver slices of PHX model, and the Nile red staining lipid droplets in zebrafish primary hepatocytes from WT, HepGKO, and HepGOE groups, and quantification of the positive staining areas. Scale bar = 50 μm for oil red O staining and 10 μm for Nile red staining. n = 12 samples for oil red O staining, 1 fish per sample. n = 8 fish per group for Nile red staining. One-way ANOVA, ****P < 0.0001 vs. WT group. All experiments were repeated on at least 3 clutches. BC, baseline control; ccnd1, cyclin D1; DAPI, 4′,6-diamidino-2-phenylindole; gapdh, glyceraldehyde-3-phosphate dehydrogenase; hep-gmfb, gmfb in hepatocyte; HepGKO, hepatocyte-specific gmfb knockout; HepGOE, hepatocyte-specific gmfb overexpression; hpp, hours post-PHX; il1β, interleukin 1 beta; il6, interleukin 6; jun, Jun proto-oncogene, AP-1 transcription factor subunit; LBR, liver-to-body weight ratio; myca, MYC proto-oncogene, bHLH transcription factor a; pcna, proliferating cell nuclear antigen; PHX, partial hepatectomy; pparab, peroxisome proliferator-activated receptor alpha b; pnpla2, patatin-like phospholipase domain containing 2; tnfα, tumor necrosis factor alpha; wpf, weeks post fertilization; WT, wild-type. |
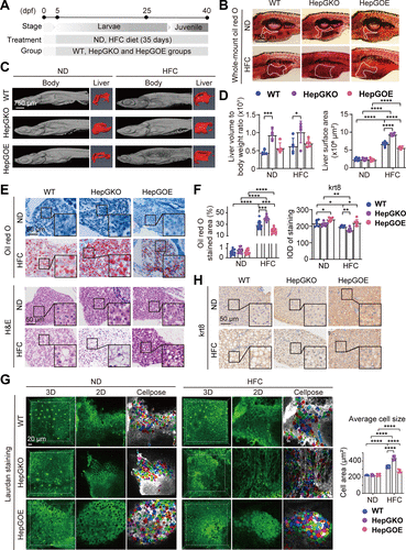
Hep-gmfb prevents hepatic steatosis and hepatocyte ballooning in MASLD. A: schematic illustration of the construction of zebrafish MASLD model with WT, HepGKO, and HepGOE lines, respectively. B and D: representative whole mount oil red O staining images of zebrafish slices from ND and HFC groups of WT, HepGKO, and HepGOE lines, respectively, with the liver contours indicated by white dotted lines (B), and the quantification of the liver contour areas (D). Scale bar = 750 μm. n = 12 fish per group. One-way ANOVA, ****P < 0.0001 vs. ND or WT group. C and D: representative micro-CT images of the fixed and 4% phosphotungstic acid stained zebrafish from ND and HFC groups of WT, HepGKO, and HepGOE lines, respectively and their livers of 3-D reconstruction (C), and the quantification of the liver volume to body weight (D) from ND and HFC groups of WT, HepGKO, and HepGOE zebrafish. Scale bar = 750 μm. n = 5 fish per group. One-way ANOVA, *P < 0.05, ***P < 0.001 vs. ND or WT group. E: representative H&E and oil red O staining images in liver slices from ND and HFC groups of WT, HepGKO, and HepGOE zebrafish. Oil red O staining shows lipid droplets in liver cells. Scale bar = 50 μm. n = 12 fish per group. F: quantification of oil red O positive staining area for lipid droplets in (E) and krt8 positive staining density in (H) in liver samples from ND and HFC groups of WT, HepGKO, and HepGOE zebrafish. Scale bar = 50 μm. n = 12 fish per group for oil red O staining, and n = 8 fish per group for immunohistochemistry. One-way ANOVA, *P < 0.05, **P < 0.01, ***P < 0.001, ****P < 0.0001 vs. ND or WT group. G: the 3-dimensional (3-D), 2-D, and the Cellpose tool processed representative images of Laurdan stained (green) livers by in vivo imaging the ND and HFC groups of WT, HepGKO, and HepGOE zebrafish with multiphoton fluorescence microscopy and the quantification of cell sizes by measuring individual cellular areas in the Cellpose processed images. Scale bar = 20 μm. n = 8 fish per group. One-way ANOVA, ****P < 0.0001 vs. ND or WT group. H: representative images of anti-krt8 immunochemistry in liver slices from ND and HFC groups of WT, HepGKO, and HepGOE zebrafish. Scale bar = 50 μm. n = 8 fish per group. All experiments were repeated on at least 3 clutches. H&E, hematoxylin and eosin; hep-gmfb, gmfb in hepatocyte; HepGKO, hepatocyte-specific gmfb knockout; HepGOE, hepatocyte-specific gmfb overexpression; HFC, high fat, high cholesterol diet; IOD, integral optical density; krt8, cytokeratin 8; MASLD, metabolism-associated steatotic liver disease; ND, normal diet; WT, wild-type. |
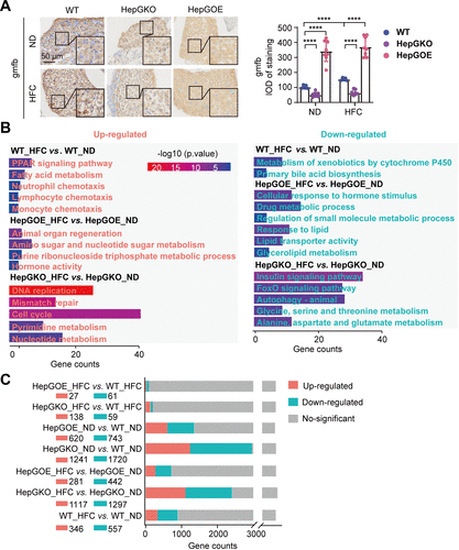
Transcriptome analysis of zebrafish in MASLD liver. A: representative anti-gmfb immunochemical images in liver slices from ND and HFC groups of WT, HepGKO, and HepGOE zebrafish, and quantification of the gmfb-positive staining density. Scale bar = 50 μm. n = 8 fish per group. Experiments were repeated on at least 3 clutches. One-way ANOVA, ****P < 0.0001 vs. ND or WT group. B: GO and KEGG analyses of transcriptome data associated with comparison of WT_HFC vs. WT_ND, HepGOE_HFC vs. HepGOE_ND, and HepGKO_HFC vs. HepGKO_ND. n = 2 samples for each group, 10 fish per sample. Significant functional entries were identified with criteria of P value < 0.05. C: bar plot shows the differential gene expression of transcriptome data defined with criteria of |log2(Fold Change)| > 1 and Padj < 0.05. n = 2 samples for each group, 10 fish per sample. gmfb, glia maturation factor-β; GO, Gene Ontology; hep-gmfb, gmfb in hepatocyte; HepGKO, hepatocyte-specific gmfb knockout; HepGOE, hepatocyte-specific gmfb overexpression; HFC, high fat, high cholesterol diet; IOD, integral optical density; KEGG; Kyoto Encyclopedia of Genes and Genomes; MASLD, metabolism-associated steatotic liver disease; ND, normal diet; WT, wild-type. |
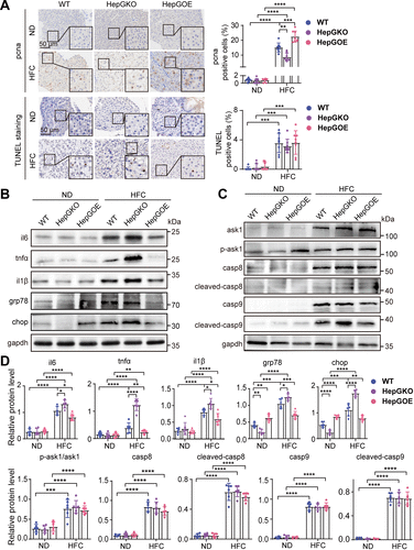
Effect of hep-gmfb abundance on the molecular functional pathways in MASLD liver. A: representative anti-pcna immunochemical images and TUNEL staining images in liver sections from ND and HFC groups of WT, HepGKO, and HepGOE zebrafish, and quantification of the positive staining cells. Scale bar = 50 μm. n = 8 fish per group. One-way ANOVA, **P < 0.01, ***P < 0.001, ****P < 0.0001 vs. ND or WT group. B–D: expression levels of proteins il6, tnfα, il1β, grp78, and chop (B); and ask1, p-ask1, casp8, cleaved-casp8, casp9, and cleaved-casp9 (C) with gapdh as normalization control in liver samples from ND and HFC groups of WT, HepGKO, and HepGOE zebrafish. n = 6 samples for liver tissue, 10 fish per sample. Data were presented as relative expression levels (D). One-way ANOVA, *P < 0.05, **P < 0.01, ***P < 0.001, ****P < 0.0001 vs. ND or WT group. Experiments were repeated on at least 3 clutches. ask1, apoptosis signal regulating kinase-1; casp 8, caspase 8; casp 9, caspase 9; chop, C/EBP homologous protein; gapdh, glyceraldehyde-3-phosphate dehydrogenase; grp78, glucose-regulated protein 78; hep-gmfb, gmfb in hepatocyte; HepGKO, hepatocyte-specific gmfb knockout; HepGOE, hepatocyte-specific gmfb overexpression; HFC, high fat, high cholesterol diet; il1β, interleukin 1 beta; il6, interleukin 6; MASLD, metabolism-associated steatotic liver disease; ND, normal diet; pcna, proliferating cell nuclear antigen; tnfα, tumor necrosis factor alpha; TUNEL, terminal dexynucleotidyl transferase (TdT)-mediated dUTP nick end labeling; WT, wild-type. |
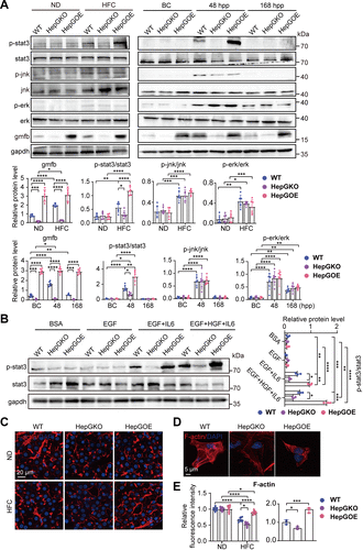
Gmfb enhances il6/stat3 activation and actin-filaments distribution in zebrafish hepatocytes. A: expression levels of proteins p-stat3, stat3, p-jnk, jnk, p-erk, erk, gmfb, and gapdh normalization control in liver samples from PHX and MASLD models of WT, HepGKO, and HepGOE zebrafish. n = 6 samples, one fish per sample for PHX model and 10 fish per sample for MASLD model. Data were presented as relative expression levels. One-way ANOVA, *P < 0.05, **P < 0.01, ***P < 0.001, ****P < 0.0001 vs. ND, BC, or WT group. B: expression levels of proteins p-stat3, stat3, and gapdh normalization control in zebrafish primary hepatocytes treated with BSA, EGF, EGF plus IL6, or EGF plus HGF plus IL6, respectively. n = 3 samples per group, 8 fish per sample. Data were presented as relative expression levels. One-way ANOVA, *P < 0.05, **P < 0.01, ***P < 0.001, ****P < 0.0001 vs. BSA or WT group. C: representative images of phalloidin stained (red) F-actin in liver slices from ND and HFC groups of WT, HepGKO, and HepGOE zebrafish. Scale bar = 20 μm. n = 8 samples per group, one fish per sample. D: representative images of phalloidin stained (red) F-actin in 24 h post-seeding primary hepatocytes isolated from WT, HepGKO, and HepGOE zebrafish. Scale bar = 5 μm. n = 3 samples per group, 8 fish per sample. E: quantification of phalloidin (red) fluorescence intensity in C and D. One-way ANOVA, *P < 0.05, ***P < 0.001, ****P < 0.0001 vs. ND or WT group. Experiments were repeated on 3 clutches. BC, baseline control; BSA, bovine serum albumin; EGF, epidermal growth factor; erk, extracellularly regulated kinase; gapdh, glyceraldehyde-3-phosphate dehydrogenase; gmfb, glia maturation factor-β; hep-gmfb, gmfb in hepatocyte; HepGKO, hepatocyte-specific gmfb knockout; HepGOE, hepatocyte-specific gmfb overexpression; HFC, high fat, high cholesterol diet; HGF, hepatocyte growth factor; IL6, interleukine 6; jnk, c-jun N-terminal kinase; MASLD, metabolism-associated steatotic liver disease; ND, normal diet; stat3, signal transducer and activator of transcription 3; WT, wild-type. |