
|
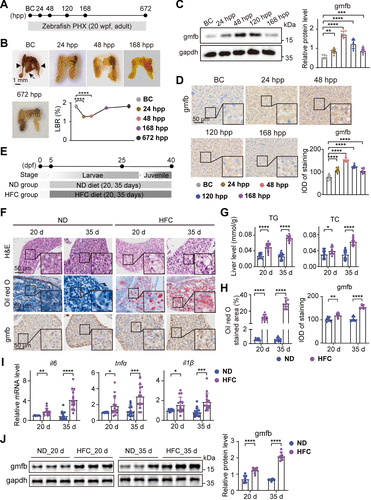
Fig. 1 Gmfb expression in liver following PHX or in MASLD. A and E: schematic illustration of the construction of zebrafish PHX and MASLD models. B: representative liver images and the change of LBR of WT zebrafish at indicated timepoints after PHX. In BC panel, the black arrowheads indicate the two lateral lobes, the black arrow indicates the ventral lobe, and the red short, dashed line indicates the PHX incision site. Scale bar = 1 mm. n = 8 fish per timepoint. One-way ANOVA, ****P < 0.0001 vs. BC group. C: protein expression levels of gmfb and gapdh as normalization control in the liver of WT zebrafish at indicated timepoints after PHx. n = 8 fish per group. Data were presented as relative expression levels. One-way ANOVA, **P < 0.01, ***P < 0.001, ****P < 0.0001 vs. BC group. D: representative anti-gmfb immunochemical images in liver slices from WT zebrafish at indicated timepoints after PHX and quantification of gmfb-positive staining density in the images. Scale bar = 50 μm. n = 8 fish per group. One-way ANOVA, ****P < 0.0001 vs. BC group. F: representative H&E, oil red O, and anti-gmfb immunochemical staining images in zebrafish liver slices from ND and HFC groups. Scale bar = 50 μm. n = 12 samples for H&E and oil red O staining, n = 8 samples for immunochemical staining, one fish per sample. G: levels of TG and TC in liver samples of WT zebrafish at 20 d and 35 d from ND and HFC groups. n = 15 samples per group, 10 fish per sample. Two-tailed t test, *P < 0.05, ****P < 0.0001 vs. ND group. H: quantification of positive areas for lipid droplets stained with oil red O and the gmfb-positive staining density, respectively in F. Two-tailed t test, **P < 0.01, ****P < 0.0001 vs. ND group. I and J: expression levels of il6, tnfα, and il1β mRNAs (I) and gmfb and gapdh (normalization control) proteins (J) in liver samples of zebrafish at 20 d and 35 d from ND and HFC groups. n = 15 samples per group (I), n = 8 samples per group (J), 10 fish per sample. Data were presented as relative expression levels. Two-tailed t test, *P < 0.05, **P < 0.01, ***P < 0.001, ****P < 0.0001 vs. ND group. All experiments were repeated on at least 3 clutches. BC, baseline control; d, days; dpf, days post fertilization; gapdh, glyceraldehyde-3-phosphate dehydrogenase; gmfb, glia maturation factor-β; H&E, hematoxylin and eosin; HFC, high fat, high cholesterol diet; hpp, hours post PHX; il1β, interleukin 1 beta; il6, interleukin 6; IOD, integral optical density; LBR, liver-to-body weight ratio; MASLD, metabolism-associated steatotic liver disease; ND, normal diet; PHX, partial hepatectomy; TC, total cholesterol, TG, triglycerides; tnfα, tumor necrosis factor alpha; wpf, weeks post fertilization; WT, wild-type.