
|
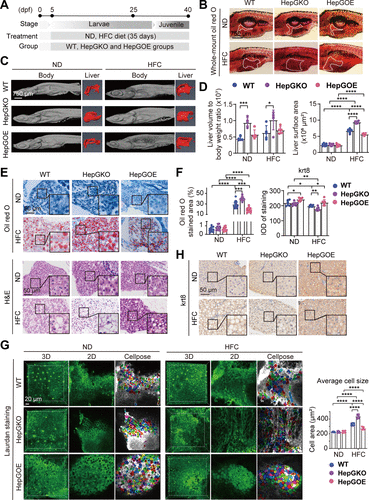
Fig. 3 Hep-gmfb prevents hepatic steatosis and hepatocyte ballooning in MASLD. A: schematic illustration of the construction of zebrafish MASLD model with WT, HepGKO, and HepGOE lines, respectively. B and D: representative whole mount oil red O staining images of zebrafish slices from ND and HFC groups of WT, HepGKO, and HepGOE lines, respectively, with the liver contours indicated by white dotted lines (B), and the quantification of the liver contour areas (D). Scale bar = 750 μm. n = 12 fish per group. One-way ANOVA, ****P < 0.0001 vs. ND or WT group. C and D: representative micro-CT images of the fixed and 4% phosphotungstic acid stained zebrafish from ND and HFC groups of WT, HepGKO, and HepGOE lines, respectively and their livers of 3-D reconstruction (C), and the quantification of the liver volume to body weight (D) from ND and HFC groups of WT, HepGKO, and HepGOE zebrafish. Scale bar = 750 μm. n = 5 fish per group. One-way ANOVA, *P < 0.05, ***P < 0.001 vs. ND or WT group. E: representative H&E and oil red O staining images in liver slices from ND and HFC groups of WT, HepGKO, and HepGOE zebrafish. Oil red O staining shows lipid droplets in liver cells. Scale bar = 50 μm. n = 12 fish per group. F: quantification of oil red O positive staining area for lipid droplets in (E) and krt8 positive staining density in (H) in liver samples from ND and HFC groups of WT, HepGKO, and HepGOE zebrafish. Scale bar = 50 μm. n = 12 fish per group for oil red O staining, and n = 8 fish per group for immunohistochemistry. One-way ANOVA, *P < 0.05, **P < 0.01, ***P < 0.001, ****P < 0.0001 vs. ND or WT group. G: the 3-dimensional (3-D), 2-D, and the Cellpose tool processed representative images of Laurdan stained (green) livers by in vivo imaging the ND and HFC groups of WT, HepGKO, and HepGOE zebrafish with multiphoton fluorescence microscopy and the quantification of cell sizes by measuring individual cellular areas in the Cellpose processed images. Scale bar = 20 μm. n = 8 fish per group. One-way ANOVA, ****P < 0.0001 vs. ND or WT group. H: representative images of anti-krt8 immunochemistry in liver slices from ND and HFC groups of WT, HepGKO, and HepGOE zebrafish. Scale bar = 50 μm. n = 8 fish per group. All experiments were repeated on at least 3 clutches. H&E, hematoxylin and eosin; hep-gmfb, gmfb in hepatocyte; HepGKO, hepatocyte-specific gmfb knockout; HepGOE, hepatocyte-specific gmfb overexpression; HFC, high fat, high cholesterol diet; IOD, integral optical density; krt8, cytokeratin 8; MASLD, metabolism-associated steatotic liver disease; ND, normal diet; WT, wild-type.