
|
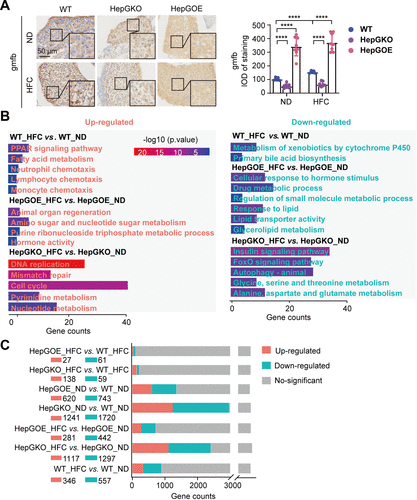
Fig. 4 Transcriptome analysis of zebrafish in MASLD liver. A: representative anti-gmfb immunochemical images in liver slices from ND and HFC groups of WT, HepGKO, and HepGOE zebrafish, and quantification of the gmfb-positive staining density. Scale bar = 50 μm. n = 8 fish per group. Experiments were repeated on at least 3 clutches. One-way ANOVA, ****P < 0.0001 vs. ND or WT group. B: GO and KEGG analyses of transcriptome data associated with comparison of WT_HFC vs. WT_ND, HepGOE_HFC vs. HepGOE_ND, and HepGKO_HFC vs. HepGKO_ND. n = 2 samples for each group, 10 fish per sample. Significant functional entries were identified with criteria of P value < 0.05. C: bar plot shows the differential gene expression of transcriptome data defined with criteria of |log2(Fold Change)| > 1 and Padj < 0.05. n = 2 samples for each group, 10 fish per sample. gmfb, glia maturation factor-β; GO, Gene Ontology; hep-gmfb, gmfb in hepatocyte; HepGKO, hepatocyte-specific gmfb knockout; HepGOE, hepatocyte-specific gmfb overexpression; HFC, high fat, high cholesterol diet; IOD, integral optical density; KEGG; Kyoto Encyclopedia of Genes and Genomes; MASLD, metabolism-associated steatotic liver disease; ND, normal diet; WT, wild-type.