
- Title
-
OPN3-mediated positive regulation of angiogenesis in HUVECs through VEGFR2 interaction
- Authors
- Luo, H., Zhang, W., Zeng, W., Wang, Y., Feng, J., Lan, Y., Dong, X., Liu, T., Sun, Y., Lu, H.
- Source
- Full text @ Commun Biol
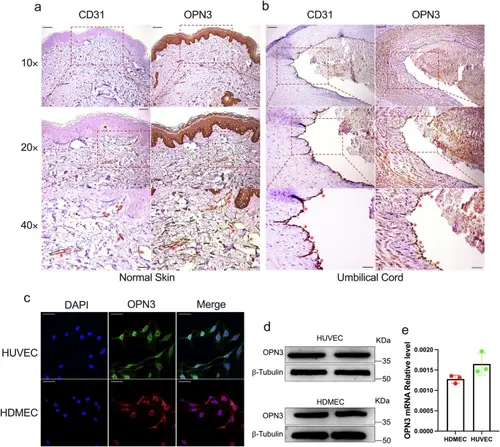
OPN3 expression in primary human vascular endothelial cells: HUVECs and HDMECs.a IHC staining of human skin tissue for CD31 and OPN3. CD31 positively marks dermal microvascular endothelial cells in human skin tissue, while OPN3 staining shows its expression in human skin, with higher expression observed in the basal layer of the epidermis. Comparing with the CD31-positive areas, OPN3-positive reactions were found in the same locations, indicating that OPN3 is expressed in HDMECs. The scale bar in the 10× panel corresponds to 100 μm, while the scale bar in the 20× panel represents 50 μm, and the scale bar in the 40× panel indicates 25 μm. Red asterisks indicate the locations of HDMECs. b IHC staining of human umbilical vein tissue for CD31 and OPN3. CD31 positively marks endothelial cells in the human umbilical vein tissue, while OPN3 staining shows its expression in the umbilical vein. Comparing with the CD31-positive areas, OPN3-positive reactions were found in the same locations, indicating that OPN3 is expressed in HUVECs. The scale bar in the 10× panel corresponds to 100 μm, while the scale bar in the 20× panel represents 50 μm, and the scale bar in the 40× panel indicates 25 μm. Red asterisks indicate the locations of HUVECs. c Laser confocal microscopy analysis of OPN3 protein expression and localization in HUVECs and HDMECs. Green indicates OPN3 in HUVECs, red indicates OPN3 in HDMECs, and blue represents the nucleus. The results show that OPN3 protein is mainly located on the plasma membrane. The scale bar represents 50 μm. d Western blot analysis of OPN3 protein expression in HDMECs and HUVECs, with β-tubulin used as a loading control for normalization of the WB analysis. e RT-qPCR analysis of OPN3 mRNA expression in HDMECs and HUVECs. The relative mRNA expression levels were calculated using the 2−ΔCt method, with GAPDH serving as the internal control (n = 3 independent experiments, with each experimental group consisting of 6 dishes, derived from 3 different donors, with each donor providing 2 dishes of cells). |
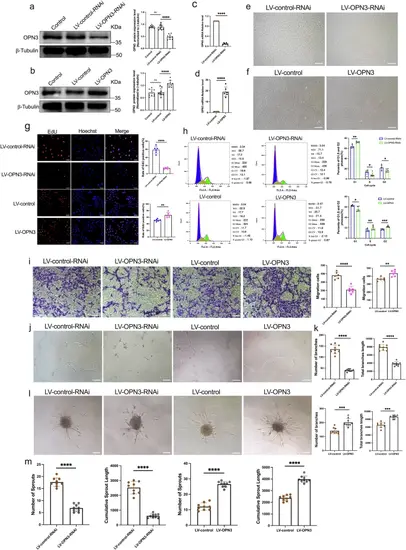
The regulatory effects of OPN3 knockdown and overexpression on HUVECs proliferation, migration, tube formation and sprouting.In HUVECs, the OPN3 knockdown cell model was constructed using LV-OPN3-RNAi lentivirus and the control LV-control-RNAi lentivirus. The OPN3 overexpression cell model was constructed using LV-OPN3 and the control LV-control lentivirus, with the uninfected group serving as the Control. a, b The OPN3 protein levels were verified by Western blot, using β-tubulin as a loading control for normalization of the WB analysis. Relative protein levels were quantified using ImageJ software (n = 9 independent experiments, with each experimental group consisting of 18 dishes, derived from 9 different donors, with each donor providing 2 dishes of cells). Statistical analysis was performed using an unpaired t-test: ns: not significant, ****p < 0.0001. c, d The OPN3 mRNA levels were verified by RT-qPCR. The relative mRNA expression levels were calculated using the 2−ΔΔCt method, with GAPDH serving as the internal control (n = 6 independent experiments, with each experimental group consisting of 12 dishes, derived from 6 different donors, with each donor providing 2 dishes of cells). Statistical analysis was performed using an unpaired t-test: ****p < 0.0001. This analysis confirmed the successful construction of different experimental group cells. e, f After successful construction of the cell models, optical microscopy was used to observe the morphology and quantity of cells in different experimental groups. The scale bar represents 100 μm. g The cell proliferation was assessed by detecting the ratio of EdU-positive nuclei to total nuclei in different experimental groups. Blue Hoechst represents the total number of cells, while red represents EdU-positive cells. The counts of blue Hoechst and red EdU were analyzed using ImageJ software (n = 6 dishes of cultured HUVECs from 3 different donors, with each donor replicated twice). Statistical analysis was performed using an unpaired t-test: **p < 0.01, ****p < 0.0001. The scale bar represents 50 μm. h The cell cycle in different experimental groups was analyzed by flow cytometry using FlowJo software (n = 6 independent experiments, with each experimental group consisting of 12 dishes, derived from 6 different donors, with each donor providing 2 dishes of cells). Statistical analysis was performed using an unpaired t-test: *p < 0.05, **p < 0.01, ***p < 0.0001. i The migration of cells in different experimental groups was assessed using the transwell assay, and images were captured under an optical microscope. The number of migrating cells was counted after staining with crystal violet, analyzed using ImageJ software (n = 6 dishes of cultured HUVECs from 3 different donors, with each donor replicated twice). Statistical analysis was performed using an unpaired t-test: **p < 0.01, ****p < 0.0001. The scale bar represents 100 μm. j, k Cells from different experimental groups were seeded on Matrigel for 10 h to record and quantify the tube formation. The number and length of branches were analyzed using ImageJ software to determine the extent of tube formation (n = 9 dishes of cultured HUVECs from 3 different donors, with each donor replicated three times). Statistical analysis was performed using an unpaired t-test: ***p < 0.001, ****p < 0.0001. The scale bar represents 100 μm. l, m Spheroid sprouting experiments were conducted with cells from different experimental groups. The sprouts were recorded and quantified using optical microscopy, and the number and length of sprouts were analyzed using ImageJ software to evaluate the sprouting ability of ECs (n = 9 dishes of cultured HUVECs from 3 different donors, with each donor replicated three times). Statistical analysis was performed using an unpaired t-test: ****p < 0.0001. The scale bar represents 100 μm. Data are presented as mean ± SEM. |
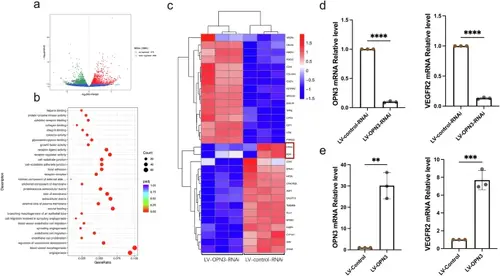
OPN3-deficient attenuates HUVECs angiogenesis.a The volcano plot of differentially expressed genes based on transcriptome sequencing results shows the fold change of gene expression (log2FoldChange) on the horizontal axis, representing the expression fold change between the LV-OPN3-RNAi and LV-control-RNAi. The vertical axis represents the significance level of the gene expression difference between the two groups (-log10pvalue). Red dots indicate upregulated genes, while green dots indicate downregulated genes. b The scatter plot of GO functional enrichment analysis based on transcriptome sequencing results is divided into three categories: biological process, cellular component, and molecular function. A total of 30 significant terms are selected from the GO enrichment analysis results for visualization, with a threshold of padj < 0.05 to define significant enrichment. The horizontal axis represents the ratio of the number of differentially expressed genes annotated to the GO term to the total number of differentially expressed genes. The vertical axis represents the GO terms. The size of the dots corresponds to the number of genes annotated to the GO term, and the color gradient from red to purple reflects the significance of enrichment. c Based on the transcriptome sequencing results, hierarchical clustering was performed on the FPKM values of the genes, and the row (genes) was normalized (Z-score). The resulting heatmap clusters genes with similar expression patterns together. In the heatmap, the colors represent the expression levels of the same gene across different samples, and each square’s color reflects the normalized expression value (ranging from −1.5 to 1.5). Red indicates higher expression, and blue indicates lower expression. d, e RT-qPCR was used to detect the mRNA expression levels of OPN3 and VEGFR2 after OPN3 knockdown and overexpression in HUVECs. The relative mRNA expression levels were calculated using the 2−ΔΔCt method, with GAPDH serving as the internal control (n = 3 independent experiments, with each experimental group consisting of 6 dishes, derived from 3 different donors, with each donor providing 2 dishes of cells). Statistical analysis was performed using an unpaired t-test: **p < 0.01, ***p < 0.001, ****p < 0.0001. |
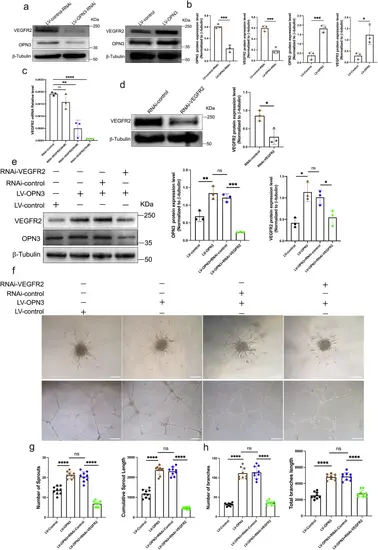
OPN3-induced proangiogenic in HUVECs is mediated by promoting VEGFR2 expression.a, b Western blot analysis was used to detect the protein expression of OPN3 and VEGFR2 after lentiviral knockdown and overexpression of OPN3, using β-tubulin as a loading control for normalization in the WB analysis. Relative protein levels were quantified using ImageJ software (n = 3 independent experiments, with each experimental group consisting of 6 dishes, derived from 3 different donors, with each donor providing 2 dishes of cells). Statistical analysis was performed using an unpaired t-test: ns (not significant), *p < 0.05, ***p < 0.001. c SiRNA was used to silence VEGFR2 expression in HUVECs. The experiment was divided into a knockdown group (RNAi-VEGFR2) and a control group (RNAi-control). RT-qPCR was used to detect the mRNA expression levels of VEGFR2 under different siRNA concentrations (30 nM, 50 nM, 70 nM). The relative mRNA expression levels were calculated using the 2−ΔΔCt method, with GAPDH serving as the internal control (n = 3 independent experiments, with each experimental group consisting of 6 dishes, derived from 3 different donors, with each donor providing 2 dishes of cells). Statistical analysis was performed using an unpaired t-test: ns (not significant), **p < 0.01, ****p < 0.0001. d Western blot analysis was used to detect VEGFR2 protein expression under 50 nM siRNA treatment, using β-tubulin as a loading control for normalization in the WB analysis. Relative protein levels were quantified using ImageJ software (n = 3 independent experiments, with each experimental group consisting of 6 dishes, derived from 3 different donors, with each donor providing 2 dishes of cells). Statistical analysis was performed using an unpaired t-test: *p < 0.05. e Western blot analysis was used to detect OPN3 and VEGFR2 protein expression levels in different cell groups with overexpression of OPN3 or simultaneous overexpression of OPN3 and knockdown of VEGFR2, using β-tubulin as a loading control for normalization in the WB analysis. Relative protein levels were quantified using ImageJ software (n = 3 independent experiments, with each experimental group consisting of 6 dishes, derived from 3 different donors, with each donor providing 2 dishes of cells). Statistical analysis was performed using an unpaired t-test: ns (not significant), *p < 0.05, **p < 0.01, ***p < 0.001. f, h Cells from different experimental groups were seeded on Matrigel for 10 h to record and quantify tube formation. The number and length of branches were analyzed using ImageJ software to determine the extent of tube formation. f, g Spheroid sprouting experiments were conducted with cells from different experimental groups. The sprouts were recorded and quantified using optical microscopy, and the number and length of sprouts were analyzed using ImageJ software to evaluate the sprouting ability of HUVECs (n = 9 dishes of cultured HUVECs from 3 different donors, with each donor replicated three times). Statistical analysis was performed using an unpaired t-test: ns (not significant), ****p < 0.0001. The scale bar represents 100 μm. Data are presented as mean ± SEM. |
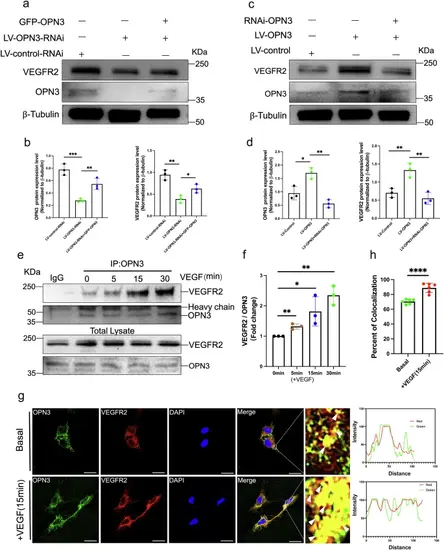
OPN3 and VEGFR2 are able to form a complex.a, b Western blot analysis was used to detect the protein levels of OPN3 and VEGFR2 in different cell groups with lentiviral knockdown of OPN3 or lentiviral knockdown of OPN3 combined with plasmid overexpression of OPN3 (GFP-OPN3), using β-tubulin as a loading control for normalization in the WB analysis. Relative protein levels were quantified using ImageJ software (n = 3 independent experiments, with each experimental group consisting of 6 dishes, derived from 3 different donors, with each donor providing 2 dishes of cells). Statistical analysis was performed using an unpaired t-test: ns (not significant), *p < 0.05, **p < 0.01, ***p < 0.001. c, d Western blot analysis was used to detect the protein levels of OPN3 and VEGFR2 in different cell groups with lentiviral overexpression of OPN3 or overexpression of OPN3 combined with siRNA-mediated knockdown of OPN3 (RNAi-OPN3), using β-tubulin as a loading control for normalization in the WB analysis. Relative protein levels were quantified using ImageJ software (n = 3 independent experiments, with each experimental group consisting of 6 dishes, derived from 3 different donors, with each donor providing 2 dishes of cells). Statistical analysis was performed using an unpaired t-test: *p < 0.05, **p < 0.01. e HUVECs were stimulated with VEGF (25 ng/mL), and cells were collected at different time points (5 min, 15 min, 30 min) to detect the interaction between OPN3 and VEGFR2 by Co-IP. Anti-OPN3 or anti-IgG (negative control) antibodies were used for immunoprecipitation (IP), followed by western blot analysis to detect OPN3 and VEGFR2 protein levels. Relative protein levels were quantified using ImageJ software. f Bar graph represents the averaged fold change of VEGFR2/OPN3 ratio over the basal ratio (n = 3 independent experiments, with each experimental group consisting of 12 dishes, derived from 6 different donors, with each donor providing 2 dishes of cells). Statistical analysis was performed using an unpaired t-test: *p < 0.05, **p < 0.01. g, h HUVECs were stimulated or not stimulated with VEGF for 15 min, followed by co-staining of OPN3 and VEGFR2. Images were captured using confocal microscopy. OPN3 was labeled in green, VEGFR2 in red, and DAPI in blue. The scale bar represents 25 μm. Yellow fluorescence (indicated by white arrows) in the merged images indicates their colocalization, which was analyzed by comparing the fluorescence intensity of each protein along the white line in the magnified images of the white box. A bar graph shows the percentage of colocalization (n = 6 dishes of cultured HUVECs from 3 different donors, with each donor replicated twice). Statistical analysis was performed using an unpaired t-test: ***p < 0.001. |

The proangiogenic effects induced by OPN3 are possibly mediated through the promotion of AKT activation.a The scatter plot of KEGG pathway enrichment based on transcriptome sequencing results. KEGG pathway enrichment was considered significant with a threshold of padj < 0.05. The top 20 most significant KEGG pathways were selected for visualization in the scatter plot. The horizontal axis represents the ratio of differentially expressed genes annotated to KEGG pathways to the total number of differentially expressed genes. The vertical axis represents the KEGG pathways. The size of the dots corresponds to the number of genes annotated to the KEGG pathway, and the color gradient from red to purple reflects the significance of enrichment. The PI3K-AKT pathway was significantly enriched, as indicated by the red horizontal line. b, c Western blot analysis was used to detect the protein expression of OPN3, AKT, and p-AKT in OPN3 knockdown or overexpression HUVECs, using β-tubulin as a loading control for normalization in the WB analysis. Relative protein levels were quantified using ImageJ software (n = 3 independent experiments, with each experimental group consisting of 6 dishes, derived from 3 different donors, with each donor providing 2 dishes of cells). Statistical analysis was performed using an unpaired t-test: ns (not significant), *p < 0.05, **p < 0.01. d Western blot analysis was used to detect the protein levels of AKT and p-AKT in different cell groups with OPN3 overexpression or OPN3 overexpression followed by treatment with 10 μM MK-2206, using β-tubulin as a loading control for normalization in the WB analysis. Relative protein levels were quantified using ImageJ software (n = 3 independent experiments, with each experimental group consisting of 6 dishes, derived from 3 different donors, with each donor providing 2 dishes of cells). Statistical analysis was performed using an unpaired t-test: ns (not significant), **p < 0.01. e, f Cells from different experimental groups were seeded on Matrigel for 10 h to record and quantify tube formation. The number and length of branches were analyzed using ImageJ software to determine the extent of tube formation. Spheroid sprouting experiments were conducted with cells from different experimental groups. The sprouts were recorded and quantified using optical microscopy, and the number and length of sprouts were analyzed using ImageJ software to evaluate the sprouting ability of HUVECs (n = 3 independent experiments, with each experimental group consisting of 6 dishes, derived from 3 different donors, with each donor providing 2 dishes of cells). Statistical analysis was performed using an unpaired t-test: ****p < 0.0001. The scale bar represents 100 μm. g Western blot analysis was used to detect the protein levels of AKT and p-AKT in different cell groups with OPN3 knockdown or OPN3 knockdown followed by treatment with 10 μM SC79, using β-tubulin as a loading control for normalization in the WB analysis. Relative protein levels were quantified using ImageJ software (n = 3 independent experiments, with each experimental group consisting of 6 dishes, derived from 3 different donors, with each donor providing 2 dishes of cells). Statistical analysis was performed using an unpaired t-test: ns (not significant), *p < 0.05, **p < 0.01. h, i. Cells from different experimental groups were seeded on Matrigel for 10 h to record and quantify tube formation. The number and length of branches were analyzed using ImageJ software to determine the extent of tube formation. Spheroid sprouting experiments were conducted with cells from different experimental groups. The tube formation was recorded and quantified using optical microscopy, and the number and length of sprouts were analyzed using ImageJ software to evaluate the sprouting ability of HUVECs (n = 9 dishes of cultured HUVECs from 3 different donors, with each donor replicated three times). Statistical analysis was performed using an unpaired t-test: ****p < 0.0001. The scale bar represents 100 μm. Data are presented as mean ± SEM. |
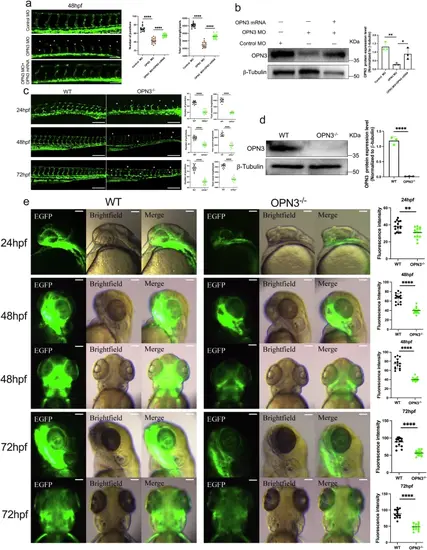
Silencing or knockout of OPN3 causes angiogenesis deficiency during embryogenesis.a Inject fli1:EGFP transgenic zebrafish embryos with control MO, OPN3 MO, or OPN3 MO and OPN3 mRNA (rescue), and image the treated embryos from each group at 48 hpf using a confocal microscope. Dorsal longitudinal anastomotic vessels (DLAVs) were absent in many places (*). Intersegmental vessels (ISVs) were discontinuous, thin and short (*). The scale bar represents 100 μm. Use ImageJ to analyze the total vessel length and the number of junctions in the images from each group (n = 15, each individual data point represents a single zebrafish embryo). Statistical analysis was performed using an unpaired t-test: ****p < 0.0001. b Western blot analysis of OPN3 protein expression in fli1:EGFP zebrafish embryos at 48 hpf. β-tubulin was used as a loading control for normalization in the WB analysis. Relative protein levels were quantified using ImageJ (n = 3 batches of injected zebrafish embryos, each batch containing 30 embryos). Statistical analysis was performed using an unpaired t-test: ****p < 0.0001. c Confocal imaging of intersegmental vessels in wild-type (WT) sibling zebrafish embryos and OPN3 mutant zebrafish embryos (OPN3-/-) at different developmental stages (24 hpf, 48 hpf, and 72 hpf). DLAVs were absent and discontinuous in many places (*). ISVs were discontinuous, thin and short (*). The scale bar represents 100 μm. Use ImageJ to analyze the total vessel length and the number of junctions in the images from each group (n = 15, each individual data point represents a single zebrafish embryo). Statistical analysis was performed using an unpaired t-test: ****p < 0.0001. d Western blot analysis of OPN3 protein expression in WT and OPN3-/- at 48 hpf. β-tubulin was used as a loading control for normalization in the WB analysis. Relative protein levels were quantified using ImageJ (n = 3 batches of injected zebrafish embryos, each batch containing 30 embryos). Statistical analysis was performed using an unpaired t-test: ****p < 0.0001. e Confocal imaging of brain vasculature in WT and OPN3-/- at different developmental stages (24 hpf, 48 hpf, and 72 hpf). The scale bar represents 100 μm. Use ImageJ to analyze the fluorescence intensity in the images from each group (n = 15, each individual data point represents the trunk or brain region of a single zebrafish embryo). Statistical analysis was performed using an unpaired t-test: **p < 0.01, ****p < 0.0001. Data are presented as mean ± SEM. |
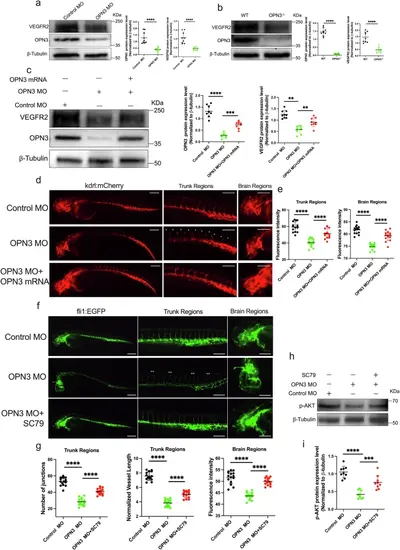
OPN3 regulates VEGFR2 expression and AKT activation in vivo.a Western blot analysis of OPN3 and VEGFR2 protein expression in fli1:EGFP zebrafish embryos after OPN3 knockdown using MO. β-tubulin was used as a loading control for normalization in the WB analysis. Relative protein levels were quantified using ImageJ (n = 9 batches of injected zebrafish embryos, each batch containing 30 embryos). Statistical analysis was performed using an unpaired t-test: ****p < 0.0001. b Western blot analysis of OPN3 and VEGFR2 protein expression in WT and OPN3-/- at 48 hpf. β-tubulin was used as a loading control for normalization in the WB analysis. Relative protein levels were quantified using ImageJ (n = 9 batches of injected zebrafish embryos, each batch containing 30 embryos). Statistical analysis was performed using an unpaired t-test: ****p < 0.0001. c Western blot analysis of OPN3 and VEGFR2 protein expression in kdrl:mCherry zebrafish embryos after OPN3 knockdown using MO, and after co-injection of OPN3 MO with OPN3 mRNA. β-tubulin was used as a loading control for normalization in the WB analysis. Relative protein levels were quantified using ImageJ (n = 9 batches of injected zebrafish embryos, each batch containing 30 embryos). Statistical analysis was performed using an unpaired t-test: **p < 0.01, ***p < 0.001, ****p < 0.0001. d Inject kdrl:mCherry transgenic zebrafish embryos with Control MO, OPN3 MO, or OPN3 MO and OPN3 mRNA, and image the treated embryos from each group at 48 hpf using a confocal microscope. The fluorescence of kdrl is absent and discontinuous in many places (*). e Use ImageJ to analyze the fluorescence intensity in the images from each group (n = 15, each individual data point represents the trunk or brain region of a single zebrafish embryo). Statistical analysis was performed using an unpaired t-test: ****p < 0.0001. The scale bar represents 100 μm. f Inject fli1:EGFP transgenic zebrafish embryos with Control MO, OPN3 MO, or OPN3 MO and SC79, and image the treated embryos from each group at 48 hpf using a confocal microscope. DLAVs and ISVs were absent and discontinuous in many places (**). g Use ImageJ to analyze the normalized vessel length and the number of junctions in the images from each group (n = 15, each individual data point represents the trunk or brain region of a single zebrafish embryo). Statistical analysis was performed using an unpaired t-test: ****p < 0.0001. The scale bar represents 100 μm. h Western blot analysis of p-AKT protein expression in fli1:EGFP zebrafish embryos after OPN3 knockdown using MO, and after co-injection of OPN3 MO with SC79. β-tubulin was used as a loading control for normalization in the WB analysis. i Relative protein levels were quantified using ImageJ (n = 9 batches of injected zebrafish embryos, each batch containing 30 embryos). Statistical analysis was performed using an unpaired t-test: ***p < 0.001, ****p < 0.0001. Data are presented as mean ± SEM. |