
|
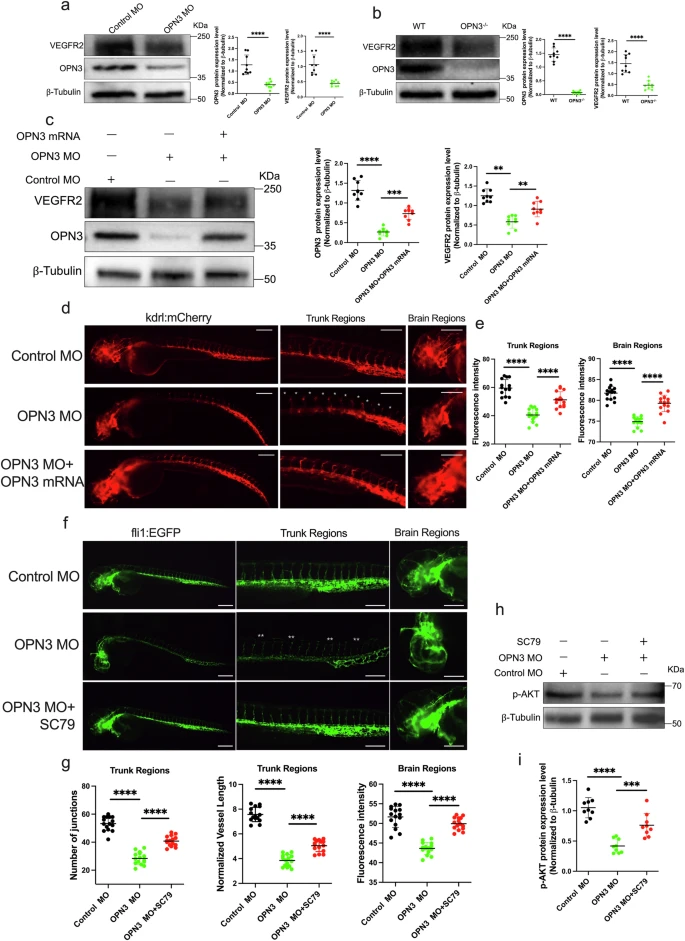
Fig. 8 OPN3 regulates VEGFR2 expression and AKT activation in vivo.a Western blot analysis of OPN3 and VEGFR2 protein expression in fli1:EGFP zebrafish embryos after OPN3 knockdown using MO. β-tubulin was used as a loading control for normalization in the WB analysis. Relative protein levels were quantified using ImageJ (n = 9 batches of injected zebrafish embryos, each batch containing 30 embryos). Statistical analysis was performed using an unpaired t-test: ****p < 0.0001. b Western blot analysis of OPN3 and VEGFR2 protein expression in WT and OPN3-/- at 48 hpf. β-tubulin was used as a loading control for normalization in the WB analysis. Relative protein levels were quantified using ImageJ (n = 9 batches of injected zebrafish embryos, each batch containing 30 embryos). Statistical analysis was performed using an unpaired t-test: ****p < 0.0001. c Western blot analysis of OPN3 and VEGFR2 protein expression in kdrl:mCherry zebrafish embryos after OPN3 knockdown using MO, and after co-injection of OPN3 MO with OPN3 mRNA. β-tubulin was used as a loading control for normalization in the WB analysis. Relative protein levels were quantified using ImageJ (n = 9 batches of injected zebrafish embryos, each batch containing 30 embryos). Statistical analysis was performed using an unpaired t-test: **p < 0.01, ***p < 0.001, ****p < 0.0001. d Inject kdrl:mCherry transgenic zebrafish embryos with Control MO, OPN3 MO, or OPN3 MO and OPN3 mRNA, and image the treated embryos from each group at 48 hpf using a confocal microscope. The fluorescence of kdrl is absent and discontinuous in many places (*). e Use ImageJ to analyze the fluorescence intensity in the images from each group (n = 15, each individual data point represents the trunk or brain region of a single zebrafish embryo). Statistical analysis was performed using an unpaired t-test: ****p < 0.0001. The scale bar represents 100 μm. f Inject fli1:EGFP transgenic zebrafish embryos with Control MO, OPN3 MO, or OPN3 MO and SC79, and image the treated embryos from each group at 48 hpf using a confocal microscope. DLAVs and ISVs were absent and discontinuous in many places (**). g Use ImageJ to analyze the normalized vessel length and the number of junctions in the images from each group (n = 15, each individual data point represents the trunk or brain region of a single zebrafish embryo). Statistical analysis was performed using an unpaired t-test: ****p < 0.0001. The scale bar represents 100 μm. h Western blot analysis of p-AKT protein expression in fli1:EGFP zebrafish embryos after OPN3 knockdown using MO, and after co-injection of OPN3 MO with SC79. β-tubulin was used as a loading control for normalization in the WB analysis. i Relative protein levels were quantified using ImageJ (n = 9 batches of injected zebrafish embryos, each batch containing 30 embryos). Statistical analysis was performed using an unpaired t-test: ***p < 0.001, ****p < 0.0001. Data are presented as mean ± SEM.