
Fig. 2
- ID
- ZDB-FIG-250430-166
- Publication
- Luo et al., 2025 - OPN3-mediated positive regulation of angiogenesis in HUVECs through VEGFR2 interaction
- Other Figures
- All Figure Page
- Back to All Figure Page
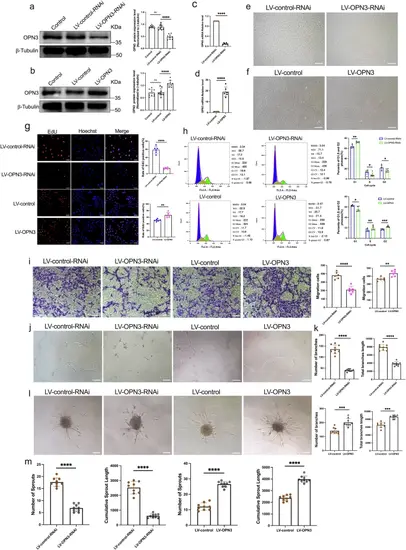
The regulatory effects of OPN3 knockdown and overexpression on HUVECs proliferation, migration, tube formation and sprouting.In HUVECs, the OPN3 knockdown cell model was constructed using LV-OPN3-RNAi lentivirus and the control LV-control-RNAi lentivirus. The OPN3 overexpression cell model was constructed using LV-OPN3 and the control LV-control lentivirus, with the uninfected group serving as the Control. a, b The OPN3 protein levels were verified by Western blot, using β-tubulin as a loading control for normalization of the WB analysis. Relative protein levels were quantified using ImageJ software (n = 9 independent experiments, with each experimental group consisting of 18 dishes, derived from 9 different donors, with each donor providing 2 dishes of cells). Statistical analysis was performed using an unpaired t-test: ns: not significant, ****p < 0.0001. c, d The OPN3 mRNA levels were verified by RT-qPCR. The relative mRNA expression levels were calculated using the 2−ΔΔCt method, with GAPDH serving as the internal control (n = 6 independent experiments, with each experimental group consisting of 12 dishes, derived from 6 different donors, with each donor providing 2 dishes of cells). Statistical analysis was performed using an unpaired t-test: ****p < 0.0001. This analysis confirmed the successful construction of different experimental group cells. e, f After successful construction of the cell models, optical microscopy was used to observe the morphology and quantity of cells in different experimental groups. The scale bar represents 100 μm. g The cell proliferation was assessed by detecting the ratio of EdU-positive nuclei to total nuclei in different experimental groups. Blue Hoechst represents the total number of cells, while red represents EdU-positive cells. The counts of blue Hoechst and red EdU were analyzed using ImageJ software (n = 6 dishes of cultured HUVECs from 3 different donors, with each donor replicated twice). Statistical analysis was performed using an unpaired t-test: **p < 0.01, ****p < 0.0001. The scale bar represents 50 μm. h The cell cycle in different experimental groups was analyzed by flow cytometry using FlowJo software (n = 6 independent experiments, with each experimental group consisting of 12 dishes, derived from 6 different donors, with each donor providing 2 dishes of cells). Statistical analysis was performed using an unpaired t-test: *p < 0.05, **p < 0.01, ***p < 0.0001. i The migration of cells in different experimental groups was assessed using the transwell assay, and images were captured under an optical microscope. The number of migrating cells was counted after staining with crystal violet, analyzed using ImageJ software (n = 6 dishes of cultured HUVECs from 3 different donors, with each donor replicated twice). Statistical analysis was performed using an unpaired t-test: **p < 0.01, ****p < 0.0001. The scale bar represents 100 μm. j, k Cells from different experimental groups were seeded on Matrigel for 10 h to record and quantify the tube formation. The number and length of branches were analyzed using ImageJ software to determine the extent of tube formation (n = 9 dishes of cultured HUVECs from 3 different donors, with each donor replicated three times). Statistical analysis was performed using an unpaired t-test: ***p < 0.001, ****p < 0.0001. The scale bar represents 100 μm. l, m Spheroid sprouting experiments were conducted with cells from different experimental groups. The sprouts were recorded and quantified using optical microscopy, and the number and length of sprouts were analyzed using ImageJ software to evaluate the sprouting ability of ECs (n = 9 dishes of cultured HUVECs from 3 different donors, with each donor replicated three times). Statistical analysis was performed using an unpaired t-test: ****p < 0.0001. The scale bar represents 100 μm. Data are presented as mean ± SEM. |