
Fig. 4
- ID
- ZDB-FIG-250430-168
- Publication
- Luo et al., 2025 - OPN3-mediated positive regulation of angiogenesis in HUVECs through VEGFR2 interaction
- Other Figures
- All Figure Page
- Back to All Figure Page
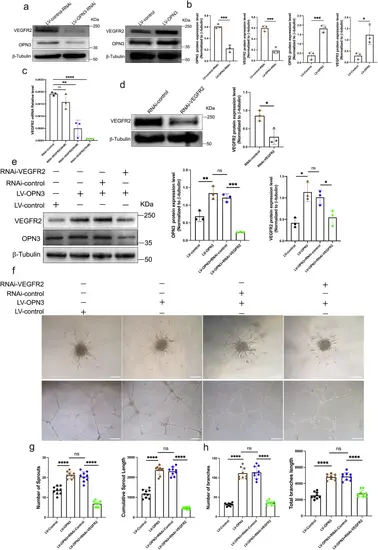
OPN3-induced proangiogenic in HUVECs is mediated by promoting VEGFR2 expression.a, b Western blot analysis was used to detect the protein expression of OPN3 and VEGFR2 after lentiviral knockdown and overexpression of OPN3, using β-tubulin as a loading control for normalization in the WB analysis. Relative protein levels were quantified using ImageJ software (n = 3 independent experiments, with each experimental group consisting of 6 dishes, derived from 3 different donors, with each donor providing 2 dishes of cells). Statistical analysis was performed using an unpaired t-test: ns (not significant), *p < 0.05, ***p < 0.001. c SiRNA was used to silence VEGFR2 expression in HUVECs. The experiment was divided into a knockdown group (RNAi-VEGFR2) and a control group (RNAi-control). RT-qPCR was used to detect the mRNA expression levels of VEGFR2 under different siRNA concentrations (30 nM, 50 nM, 70 nM). The relative mRNA expression levels were calculated using the 2−ΔΔCt method, with GAPDH serving as the internal control (n = 3 independent experiments, with each experimental group consisting of 6 dishes, derived from 3 different donors, with each donor providing 2 dishes of cells). Statistical analysis was performed using an unpaired t-test: ns (not significant), **p < 0.01, ****p < 0.0001. d Western blot analysis was used to detect VEGFR2 protein expression under 50 nM siRNA treatment, using β-tubulin as a loading control for normalization in the WB analysis. Relative protein levels were quantified using ImageJ software (n = 3 independent experiments, with each experimental group consisting of 6 dishes, derived from 3 different donors, with each donor providing 2 dishes of cells). Statistical analysis was performed using an unpaired t-test: *p < 0.05. e Western blot analysis was used to detect OPN3 and VEGFR2 protein expression levels in different cell groups with overexpression of OPN3 or simultaneous overexpression of OPN3 and knockdown of VEGFR2, using β-tubulin as a loading control for normalization in the WB analysis. Relative protein levels were quantified using ImageJ software (n = 3 independent experiments, with each experimental group consisting of 6 dishes, derived from 3 different donors, with each donor providing 2 dishes of cells). Statistical analysis was performed using an unpaired t-test: ns (not significant), *p < 0.05, **p < 0.01, ***p < 0.001. f, h Cells from different experimental groups were seeded on Matrigel for 10 h to record and quantify tube formation. The number and length of branches were analyzed using ImageJ software to determine the extent of tube formation. f, g Spheroid sprouting experiments were conducted with cells from different experimental groups. The sprouts were recorded and quantified using optical microscopy, and the number and length of sprouts were analyzed using ImageJ software to evaluate the sprouting ability of HUVECs (n = 9 dishes of cultured HUVECs from 3 different donors, with each donor replicated three times). Statistical analysis was performed using an unpaired t-test: ns (not significant), ****p < 0.0001. The scale bar represents 100 μm. Data are presented as mean ± SEM. |