
Fig. 7
- ID
- ZDB-FIG-250430-171
- Publication
- Luo et al., 2025 - OPN3-mediated positive regulation of angiogenesis in HUVECs through VEGFR2 interaction
- Other Figures
- All Figure Page
- Back to All Figure Page
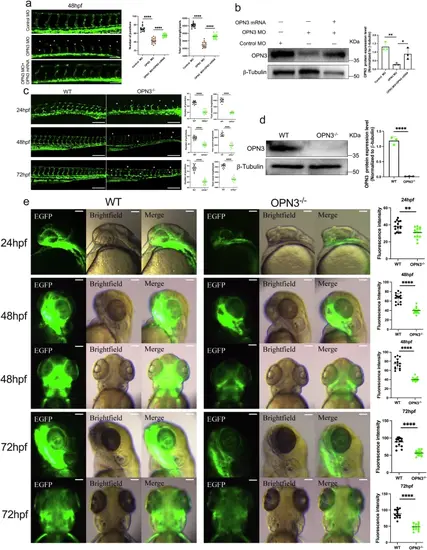
Silencing or knockout of OPN3 causes angiogenesis deficiency during embryogenesis.a Inject fli1:EGFP transgenic zebrafish embryos with control MO, OPN3 MO, or OPN3 MO and OPN3 mRNA (rescue), and image the treated embryos from each group at 48 hpf using a confocal microscope. Dorsal longitudinal anastomotic vessels (DLAVs) were absent in many places (*). Intersegmental vessels (ISVs) were discontinuous, thin and short (*). The scale bar represents 100 μm. Use ImageJ to analyze the total vessel length and the number of junctions in the images from each group (n = 15, each individual data point represents a single zebrafish embryo). Statistical analysis was performed using an unpaired t-test: ****p < 0.0001. b Western blot analysis of OPN3 protein expression in fli1:EGFP zebrafish embryos at 48 hpf. β-tubulin was used as a loading control for normalization in the WB analysis. Relative protein levels were quantified using ImageJ (n = 3 batches of injected zebrafish embryos, each batch containing 30 embryos). Statistical analysis was performed using an unpaired t-test: ****p < 0.0001. c Confocal imaging of intersegmental vessels in wild-type (WT) sibling zebrafish embryos and OPN3 mutant zebrafish embryos (OPN3-/-) at different developmental stages (24 hpf, 48 hpf, and 72 hpf). DLAVs were absent and discontinuous in many places (*). ISVs were discontinuous, thin and short (*). The scale bar represents 100 μm. Use ImageJ to analyze the total vessel length and the number of junctions in the images from each group (n = 15, each individual data point represents a single zebrafish embryo). Statistical analysis was performed using an unpaired t-test: ****p < 0.0001. d Western blot analysis of OPN3 protein expression in WT and OPN3-/- at 48 hpf. β-tubulin was used as a loading control for normalization in the WB analysis. Relative protein levels were quantified using ImageJ (n = 3 batches of injected zebrafish embryos, each batch containing 30 embryos). Statistical analysis was performed using an unpaired t-test: ****p < 0.0001. e Confocal imaging of brain vasculature in WT and OPN3-/- at different developmental stages (24 hpf, 48 hpf, and 72 hpf). The scale bar represents 100 μm. Use ImageJ to analyze the fluorescence intensity in the images from each group (n = 15, each individual data point represents the trunk or brain region of a single zebrafish embryo). Statistical analysis was performed using an unpaired t-test: **p < 0.01, ****p < 0.0001. Data are presented as mean ± SEM. |