
Fig. 3
- ID
- ZDB-FIG-250430-167
- Publication
- Luo et al., 2025 - OPN3-mediated positive regulation of angiogenesis in HUVECs through VEGFR2 interaction
- Other Figures
- All Figure Page
- Back to All Figure Page
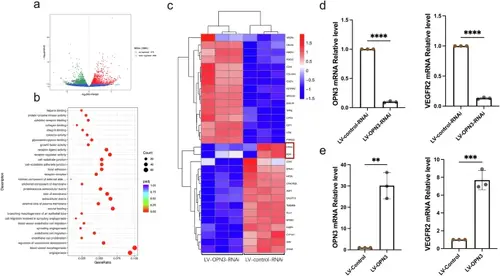
OPN3-deficient attenuates HUVECs angiogenesis.a The volcano plot of differentially expressed genes based on transcriptome sequencing results shows the fold change of gene expression (log2FoldChange) on the horizontal axis, representing the expression fold change between the LV-OPN3-RNAi and LV-control-RNAi. The vertical axis represents the significance level of the gene expression difference between the two groups (-log10pvalue). Red dots indicate upregulated genes, while green dots indicate downregulated genes. b The scatter plot of GO functional enrichment analysis based on transcriptome sequencing results is divided into three categories: biological process, cellular component, and molecular function. A total of 30 significant terms are selected from the GO enrichment analysis results for visualization, with a threshold of padj < 0.05 to define significant enrichment. The horizontal axis represents the ratio of the number of differentially expressed genes annotated to the GO term to the total number of differentially expressed genes. The vertical axis represents the GO terms. The size of the dots corresponds to the number of genes annotated to the GO term, and the color gradient from red to purple reflects the significance of enrichment. c Based on the transcriptome sequencing results, hierarchical clustering was performed on the FPKM values of the genes, and the row (genes) was normalized (Z-score). The resulting heatmap clusters genes with similar expression patterns together. In the heatmap, the colors represent the expression levels of the same gene across different samples, and each square’s color reflects the normalized expression value (ranging from −1.5 to 1.5). Red indicates higher expression, and blue indicates lower expression. d, e RT-qPCR was used to detect the mRNA expression levels of OPN3 and VEGFR2 after OPN3 knockdown and overexpression in HUVECs. The relative mRNA expression levels were calculated using the 2−ΔΔCt method, with GAPDH serving as the internal control (n = 3 independent experiments, with each experimental group consisting of 6 dishes, derived from 3 different donors, with each donor providing 2 dishes of cells). Statistical analysis was performed using an unpaired t-test: **p < 0.01, ***p < 0.001, ****p < 0.0001. |