
|
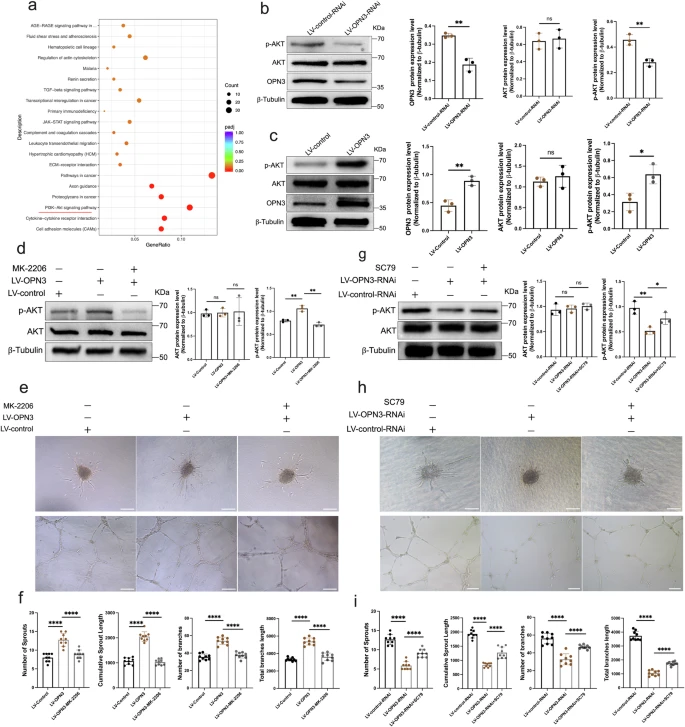
Fig. 6 The proangiogenic effects induced by OPN3 are possibly mediated through the promotion of AKT activation.a The scatter plot of KEGG pathway enrichment based on transcriptome sequencing results. KEGG pathway enrichment was considered significant with a threshold of padj < 0.05. The top 20 most significant KEGG pathways were selected for visualization in the scatter plot. The horizontal axis represents the ratio of differentially expressed genes annotated to KEGG pathways to the total number of differentially expressed genes. The vertical axis represents the KEGG pathways. The size of the dots corresponds to the number of genes annotated to the KEGG pathway, and the color gradient from red to purple reflects the significance of enrichment. The PI3K-AKT pathway was significantly enriched, as indicated by the red horizontal line. b, c Western blot analysis was used to detect the protein expression of OPN3, AKT, and p-AKT in OPN3 knockdown or overexpression HUVECs, using β-tubulin as a loading control for normalization in the WB analysis. Relative protein levels were quantified using ImageJ software (n = 3 independent experiments, with each experimental group consisting of 6 dishes, derived from 3 different donors, with each donor providing 2 dishes of cells). Statistical analysis was performed using an unpaired t-test: ns (not significant), *p < 0.05, **p < 0.01. d Western blot analysis was used to detect the protein levels of AKT and p-AKT in different cell groups with OPN3 overexpression or OPN3 overexpression followed by treatment with 10 μM MK-2206, using β-tubulin as a loading control for normalization in the WB analysis. Relative protein levels were quantified using ImageJ software (n = 3 independent experiments, with each experimental group consisting of 6 dishes, derived from 3 different donors, with each donor providing 2 dishes of cells). Statistical analysis was performed using an unpaired t-test: ns (not significant), **p < 0.01. e, f Cells from different experimental groups were seeded on Matrigel for 10 h to record and quantify tube formation. The number and length of branches were analyzed using ImageJ software to determine the extent of tube formation. Spheroid sprouting experiments were conducted with cells from different experimental groups. The sprouts were recorded and quantified using optical microscopy, and the number and length of sprouts were analyzed using ImageJ software to evaluate the sprouting ability of HUVECs (n = 3 independent experiments, with each experimental group consisting of 6 dishes, derived from 3 different donors, with each donor providing 2 dishes of cells). Statistical analysis was performed using an unpaired t-test: ****p < 0.0001. The scale bar represents 100 μm. g Western blot analysis was used to detect the protein levels of AKT and p-AKT in different cell groups with OPN3 knockdown or OPN3 knockdown followed by treatment with 10 μM SC79, using β-tubulin as a loading control for normalization in the WB analysis. Relative protein levels were quantified using ImageJ software (n = 3 independent experiments, with each experimental group consisting of 6 dishes, derived from 3 different donors, with each donor providing 2 dishes of cells). Statistical analysis was performed using an unpaired t-test: ns (not significant), *p < 0.05, **p < 0.01. h, i. Cells from different experimental groups were seeded on Matrigel for 10 h to record and quantify tube formation. The number and length of branches were analyzed using ImageJ software to determine the extent of tube formation. Spheroid sprouting experiments were conducted with cells from different experimental groups. The tube formation was recorded and quantified using optical microscopy, and the number and length of sprouts were analyzed using ImageJ software to evaluate the sprouting ability of HUVECs (n = 9 dishes of cultured HUVECs from 3 different donors, with each donor replicated three times). Statistical analysis was performed using an unpaired t-test: ****p < 0.0001. The scale bar represents 100 μm. Data are presented as mean ± SEM.