
- Title
-
Differential roles of NR4A2 (NURR1) paralogs in the brain and behavior of zebrafish
- Authors
- Kalyn, M., Garvey, R., Lee, H., Mbesha, H.A., Curry, J., Saxena, V., Mennigen, J.A., Ekker, M.
- Source
- Full text @ J. Neurochem.
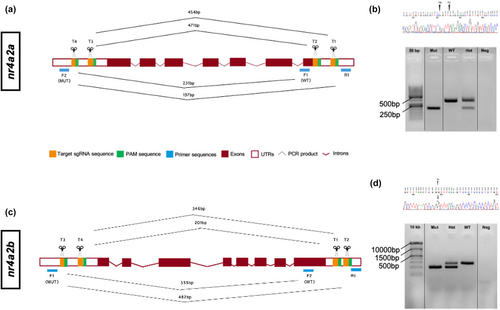
CRISPR-Cas9 mediated gene KO of nr4a2a and nr4a2b. (a) Schematic representation of sgRNAs targeting 5′ and 3’ UTR regions of nr4a2a. PCR primers used for genotyping are shown in blue. (b) Sequencing and genotyping confirmation of nr4a2a mutagenesis. (c) Schematic representation of sgRNAs targeting 5′ and 3′ UTR regions of nr4a2b. (d) Confirmation of nr4a2b mutagenesis through genotyping and sequencing. For (b, d), lanes from the same gel have been combined for presentation purposes. A photograph of the original gel is provided as Figure S1. |
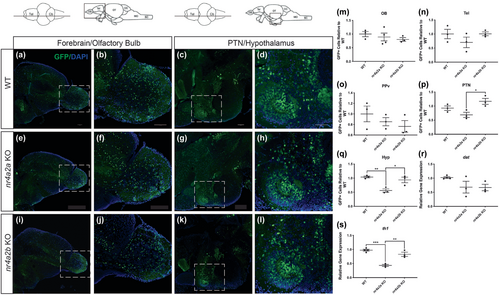
Impact on DAnergic neurons following the loss of nr4a2a and nr4a2b. (a–l) Schematic representation of OB and Hyp brain regions and the immunostaining of eGFP (green) and DAPI (blue) using sagittal cryosections. (m–q) Quantification of eGFP+ neurons in the OB, Tel, PPv, PTN, and Hyp using coronal cryosections (n = 4). One-way ANOVA. DF: Within group = 6–9, between groups = 2. m: F = 1.505, p = 0.2730; n: F = 0.6856, p = 0.5283; o: F = 1.179, p = 0.3699; p: F = 9.879, p = 0.0069; q: F = 1.1920, p = 0.3475. (r–s) dat and th1 gene expression levels in nr4a2a and nr4a2b mutants relative to WT (n = 3 brains). One-way ANOVA. DF: Within group =7, between groups =2. r: F = 2.8870, p = 0.1218; s: F = 33.56, p = 0.0003. Bars represent the Mean ± the SEM. *p < 0.05, ***p < 0.001. (Scale bar = 100 μm). OB, olfactory bulbs; Hyp, hypothalamus; PPv, periventricular pretectal nucleus; PTN, posterior tubercular nucleus; Tel, telencephalon. |
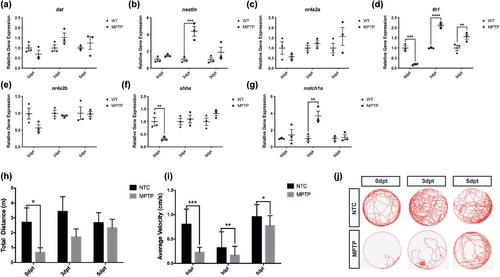
nr4a2 response following MPTP-induced neurodegeneration. (a–g) Relative gene expression is also provided for markers of regeneration, neurogenesis, DAnergic transcription, and synthesis throughout recovery in larvae (n = 3 pools of 7 larvae). One-way ANOVA: DF: Within group = 12, between groups =2. a: F = 0.9196, p = 0.3565. b: F = 26.39, p = 0.0002; c: F = 0.3415, p = 0.5698; d: F = 14.24, p = 0.0027; e: F = 3.335, p = 0.0928; f: F = 0.6289, p = 0.4432 g: F = 11.24, p = 0.0057. (h–i) Total distance traveled and average velocity of MPTP-treated and NTC control from 0- to 5dpt (n = 30). Multiple paired t tests. h: DF, 31,53, 80; t value: 2.5722; 1.6243; 0.3756, p: 0.01512; 0.1103; 0.7082; I: DF: 31, 53, 66, t values: 7.9286; 2.1412; 3.2482; p ≤ 0.000001; 0.0369; 0.0018. (j) Representative path images. Bars represent the Mean ± the SEM. **p < 0.01, ***p < 0.001, ****p < 0.0001. EXPRESSION / LABELING:
PHENOTYPE:
|
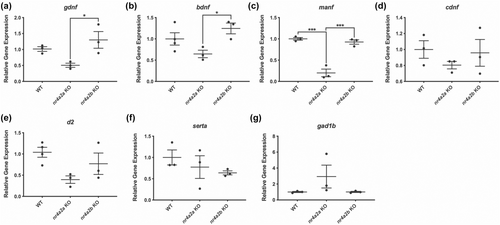
Whole brain transcriptional changes in nr4a2a and nr4a2b mutants. (a–g) Relative gene expression for neurotrophic factors, DA receptors, and other neurotransmitter systems. (n = 3 pools of 7 larvae). One-way ANOVA. DF: Within group = 6–7, between groups =2. =2. a: F = 6.2225, p = 0.0344; b: F = 4.853, p = 0.0476; c: F = 50.4, p = 0.002; d: F = 0.7511, p = 0.5116; e: 4.2060, p = 0.0631; f: F = 0.9637, p = 0.4336; g: F = 1.807, p = 0.2431. Bars represent the Mean ± the SEM. *p < 0.05, and ***p < 0.001. |

Metabolism in WT, nr4a2a and nr4a2b mutant larval zebrafish. (a) The mitochondrial oxygen consumption rate (OCR) (pmol/min) over time in zebrafish with three different genotypes (5 min per cycle). (b–e) Average basal OCR, maximal OCR, ATP-linked OCR, and non-mitochondrial OCR for nr4a2 mutant zebrafish relative to the WT controls. (n = 9–13). One = way ANOVA. DF: Within group = 29, between groups =2. b: F = 6.533, p = 0.0045; c: F = 9.688, p = 0.0006; d: F = 4.825, p = 0.0135; e: F = 10.27, p = 0.0004. Bars represent the Mean ± the SEM. |
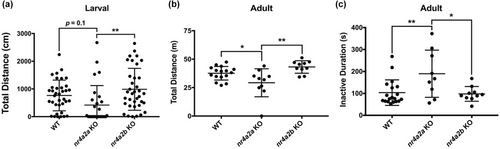
Impact on swimming activities following the loss of nr4a2a and nr4a2b. Locomotor changes between WT, nr4a2a, and nr4a2b mutants at larval (5dpf) and adult (3-6mpf) stages. The parameters analyzed were (a, b) total distance travelled and (c) inactivity duration. (n = 28–36 for larvae and 9–16 for adults). One-way ANOVA DF: Within group = 33–97, between groups = 2. a: F = 5.63, p = 0.0049; b: F = 7.807, p = 0.0017; c: F = 5.68, p = 0.0072. Bars represent the Mean ± the SD. *p < 0.05 and **p < 0.01. PHENOTYPE:
|
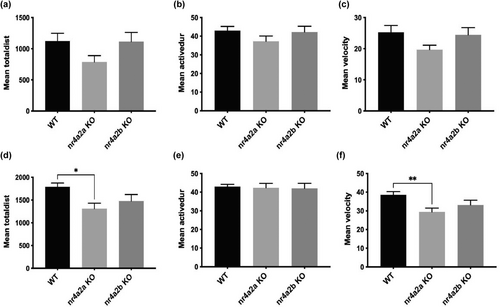
Locomotor response to light/dark cycling in nr4a2a and nr4a2b mutant zebrafish larvae at 5dpf. Response to light (a–c)/dark (d–f) cycling analyzed using (a, d) total distance swam, (b, e) mean inactive duration, and (c, f), mean velocity. (n = 24). One-way ANOVA. DF: Within group = 69, between groups =2. a: F = 2.296, p = 0.1083; b: F = 1.30, p = 0.2792; c; F = 2.2555, p = 0.1125; d: F = 4.198, p = 0.0190; e: F = 0.0475; p = 0.9536; F: f = 4.586. p = 0.0135. Bars represent the Mean ± SEM for light/dark behavior, *p < 0.05, **p < 0.01. PHENOTYPE:
|

Unillustrated author statements PHENOTYPE:
|