
Fig. 2
- ID
- ZDB-IMAGE-250313-58
- Genes
- Publication
- Kalyn et al., 2024 - Differential roles of NR4A2 (NURR1) paralogs in the brain and behavior of zebrafish
- All Figures
- Figures for Kalyn et al., 2024
|
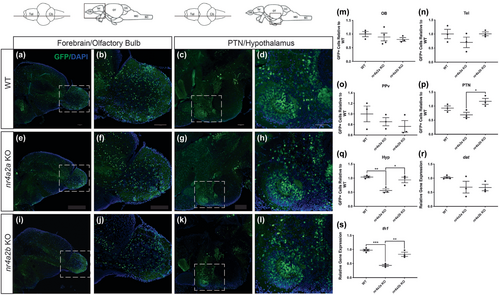
Fig. 2 Impact on DAnergic neurons following the loss of nr4a2a and nr4a2b. (a–l) Schematic representation of OB and Hyp brain regions and the immunostaining of eGFP (green) and DAPI (blue) using sagittal cryosections. (m–q) Quantification of eGFP+ neurons in the OB, Tel, PPv, PTN, and Hyp using coronal cryosections (n = 4). One-way ANOVA. DF: Within group = 6–9, between groups = 2. m: F = 1.505, p = 0.2730; n: F = 0.6856, p = 0.5283; o: F = 1.179, p = 0.3699; p: F = 9.879, p = 0.0069; q: F = 1.1920, p = 0.3475. (r–s) dat and th1 gene expression levels in nr4a2a and nr4a2b mutants relative to WT (n = 3 brains). One-way ANOVA. DF: Within group =7, between groups =2. r: F = 2.8870, p = 0.1218; s: F = 33.56, p = 0.0003. Bars represent the Mean ± the SEM. *p < 0.05, ***p < 0.001. (Scale bar = 100 μm). OB, olfactory bulbs; Hyp, hypothalamus; PPv, periventricular pretectal nucleus; PTN, posterior tubercular nucleus; Tel, telencephalon.