
FIGURE
Fig. 4
- ID
- ZDB-FIG-250313-61
- Publication
- Kalyn et al., 2024 - Differential roles of NR4A2 (NURR1) paralogs in the brain and behavior of zebrafish
- Other Figures
- All Figure Page
- Back to All Figure Page
Fig. 4
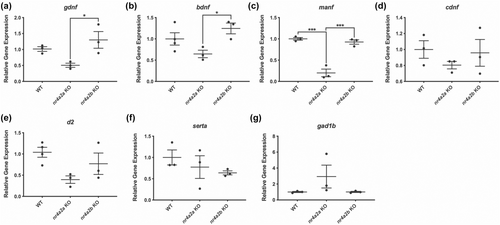
Whole brain transcriptional changes in nr4a2a and nr4a2b mutants. (a–g) Relative gene expression for neurotrophic factors, DA receptors, and other neurotransmitter systems. (n = 3 pools of 7 larvae). One-way ANOVA. DF: Within group = 6–7, between groups =2. =2. a: F = 6.2225, p = 0.0344; b: F = 4.853, p = 0.0476; c: F = 50.4, p = 0.002; d: F = 0.7511, p = 0.5116; e: 4.2060, p = 0.0631; f: F = 0.9637, p = 0.4336; g: F = 1.807, p = 0.2431. Bars represent the Mean ± the SEM. *p < 0.05, and ***p < 0.001. |
Expression Data
| Genes: | |
|---|---|
| Fish: | |
| Anatomical Term: | |
| Stage: | Adult |
Expression Detail
Antibody Labeling
Phenotype Data
| Fish: | |
|---|---|
| Observed In: | |
| Stage: | Adult |
Phenotype Detail
Acknowledgments
This image is the copyrighted work of the attributed author or publisher, and
ZFIN has permission only to display this image to its users.
Additional permissions should be obtained from the applicable author or publisher of the image.
Full text @ J. Neurochem.