
- Title
-
Impairments of cerebellar structure and function in a zebrafish KO of neuropsychiatric risk gene znf536
- Authors
- Kim, T.Y., Roychaudhury, A., Kim, H.T., Choi, T.I., Baek, S.T., Thyme, S.B., Kim, C.H.
- Source
- Full text @ Transl Psychiatry
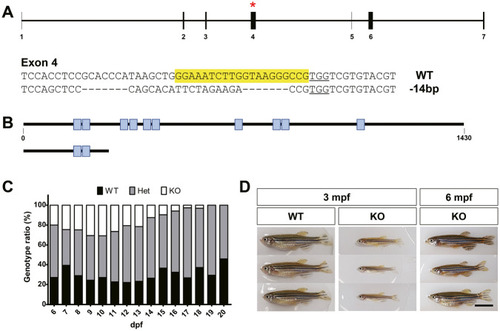
Generation of PHENOTYPE:
|
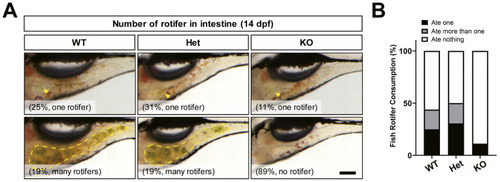
Food competition test. PHENOTYPE:
|
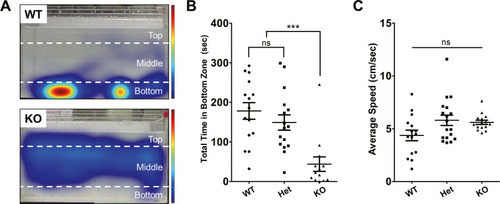
Decreased anxiety-like behavior in PHENOTYPE:
|
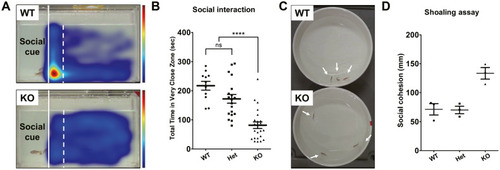
Impairments of social interaction in PHENOTYPE:
|
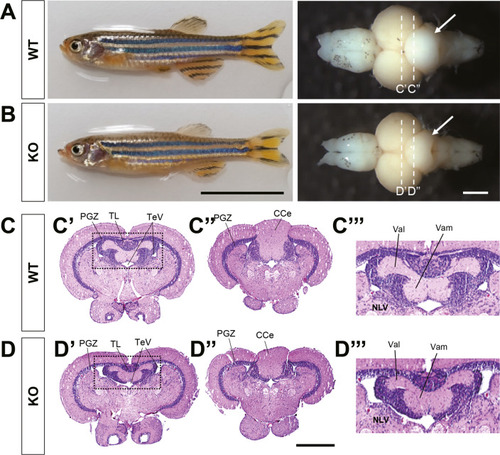
Anatomical and histological analysis of adult brains. PHENOTYPE:
|
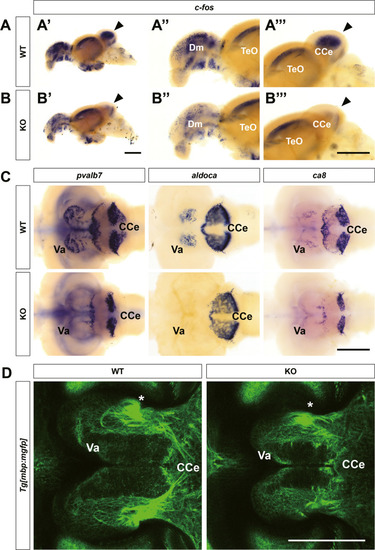
Defects in cerebellar structure and function in |

ZFIN is incorporating published figure images and captions as part of an ongoing project. Figures from some publications have not yet been curated, or are not available for display because of copyright restrictions. EXPRESSION / LABELING:
|
|
ZFIN is incorporating published figure images and captions as part of an ongoing project. Figures from some publications have not yet been curated, or are not available for display because of copyright restrictions. |
|
ZFIN is incorporating published figure images and captions as part of an ongoing project. Figures from some publications have not yet been curated, or are not available for display because of copyright restrictions. |
|
ZFIN is incorporating published figure images and captions as part of an ongoing project. Figures from some publications have not yet been curated, or are not available for display because of copyright restrictions. |