IMAGE

Fig. 4

ID
ZDB-IMAGE-240212-16
Source
Figures for Kim et al., 2024
Image
Figure Caption

Fig. 4 
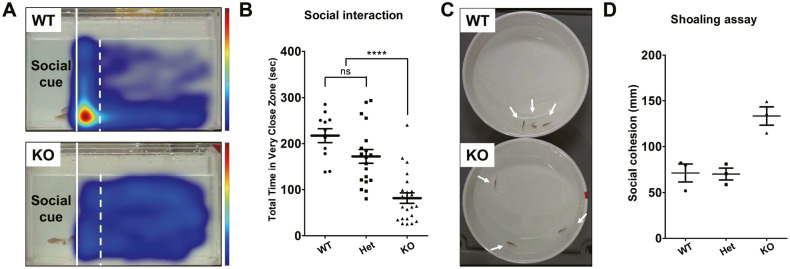
Impairments of social interaction in znf536 KO zebrafish.

A Representative heatmap of the social interaction assay. The red color indicates increased dwell time and blue indicates decreased. Solid lines indicate a transparent divider and dashed lines indicate the very close zone (2 cm from the social cue region). B Quantified data for duration within the very close zone. n = 11 for WT, n = 19 for Het, and n = 23 for KO. Data was presented as mean ± standard error of the mean (S.E.M.). Statistical significance was determined by Kruskal–Wallis test with post-hoc Dunn’s multiple comparisons test. ns, no significance; p**** < 0.0001. C Representative image from the shoaling assay. Individual adult fish were pointed by arrows. D Quantified data for the average of the inter-fish distance of the shoaling assay. The test was performed 3 times. For each trial, 3 fish of each genotype were used.

Acknowledgments
This image is the copyrighted work of the attributed author or publisher, and ZFIN has permission only to display this image to its users. Additional permissions should be obtained from the applicable author or publisher of the image. Full text @ Transl Psychiatry