
- Title
-
Thousands of oscillating LncRNAs in the mouse testis
- Authors
- Mishra, S.K., Liu, T., Wang, H.
- Source
- Full text @ Comput Struct Biotechnol J
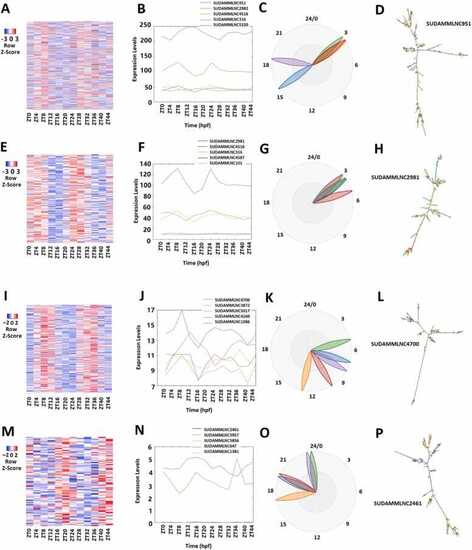
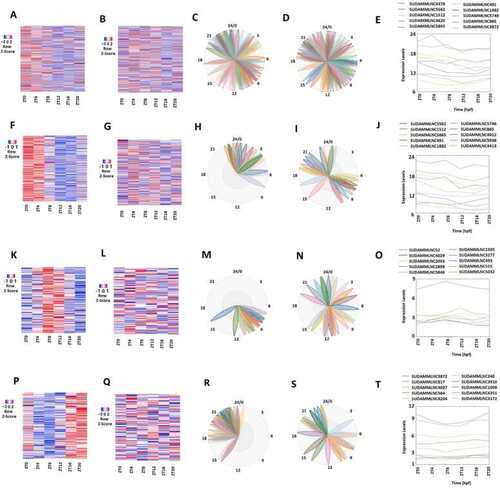
Analyses of 519 rhythmically expressed mouse testicular lncRNAs in the 12-time-point dataset measured over two consecutive days under light/dark (LD) conditions. (A-D) Analysis of all the 519 rhythmically expressed mouse testicular lncRNAs: Heat map (A) of all the 519 rhythmically expressed lncRNAs, expression profiles (B) and phases (C) of representative lncRNAs, and secondary structure plot of a representative lncRNA (D). (E-H) Analysis of 171 morning lncRNAs: Heat map of the 171 morning lncRNAs (E), expression profiles (F) and phases (G) of representative morning lncRNAs, and secondary structure plot of a representative lncRNA (H). (I-L) Analysis of 266 evening lncRNAs: Heat map of the 266 evening lncRNAs (I), expression profiles (J) and phases (K) of representative evening lncRNAs, and secondary structure plot of a representative evening lncRNA (L). (M-P) Analysis of 82 night lncRNAs: Heat map of the 82 night lncRNAs (M), expression profiles (N) and phases (O) of representative evening lncRNAs, and secondary structure plot of a representative night lncRNA (P). |
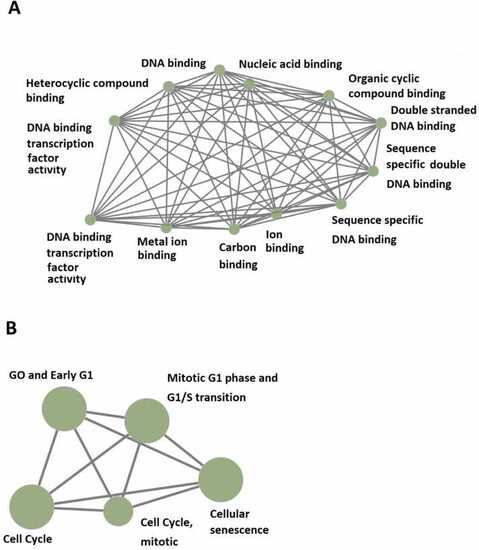
GO and KEGG analyses of 519 rhythmically expressed mouse testicular lncRNAs in the 12-time-point dataset measured over two consecutive days under light/dark (LD) conditions. (A) GO analysis revealed the potential involvement of some of these rhythmically expressed mouse testicular lncRNAs in numerous biological processes, such as DNA binding, Nucleic acid binding, Organic cyclic compound binding, Double-stranded DNA binding, Heterocyclic compound binding, DNA binding transcription factor activity, and Metal ion binding. (B) KEGG enrichment analysis shows the possible involvement of some of these rhythmically expressed mouse testicular lncRNAs in mitotic GO and Early G1, Mitotic G1 phase and G1/S transition, and Cellular senescence. |
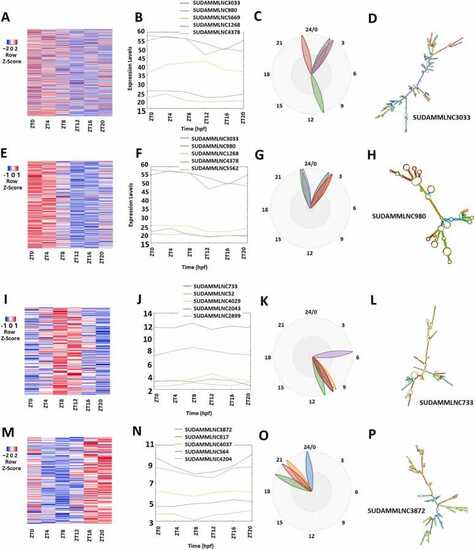
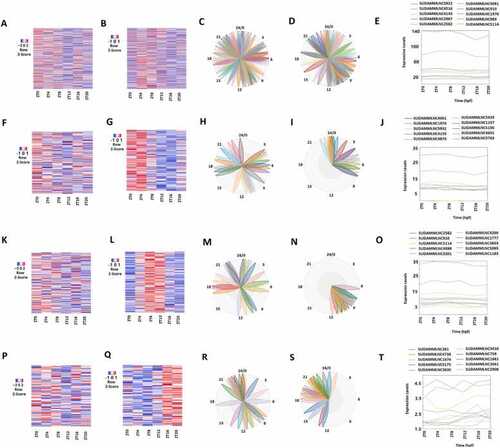
Analyses of 475 rhythmically expressed mouse testicular lncRNAs in the six-time-point control dataset measured over one day under light-dark (LD) conditions. (A-D) Analysis of all the 475 rhythmically expressed mouse testicular lncRNAs: Heat map (A) of all the 475 rhythmically expressed lncRNAs, expression profiles of representative lncRNAs (B) and phases of representative lncRNAs (C), and secondary structure plot (D) of a representative lncRNA. (E-H) Analysis of 264 morning lncRNAs: Heat map of the 264 morning lncRNAs (E), expression profiles of representative morning lncRNAs (F) and phases of representative morning lncRNAs (G), and secondary structure plot of a representative lncRNA (H). (I-L) Heat map of the 112 evening lncRNAs (I), expression profiles of representative evening lncRNAs (J) and phases of representative evening lncRNAs (K), and secondary structure plot of a representative evening lncRNA (L). (M-P) Heat map of the 99 night lncRNAs (M), expression profiles of representative evening lncRNAs (N) and phases of representative night lncRNAs (O), and secondary structure plot of a representative night lncRNA (P). |
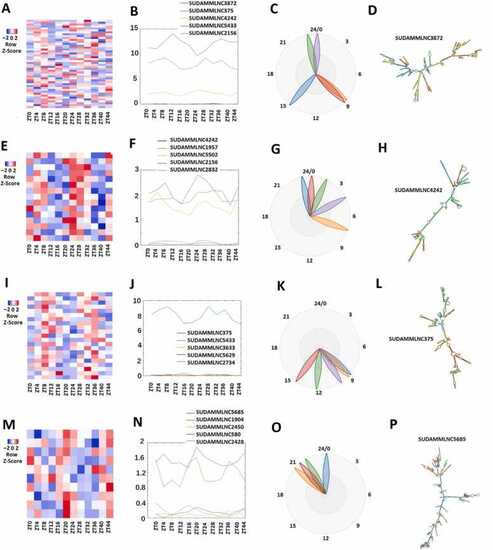
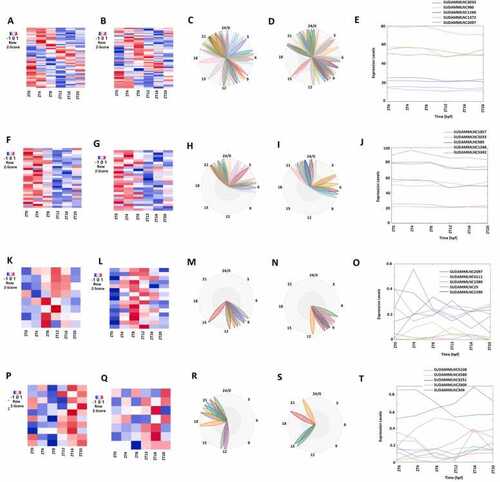
Analysis of 46 rhythmically expressed mouse testicular lncRNAs shared between the 12-point-time and 6-point-time control datasets using the 12-time-point data. (A-D) Analysis of all the 46 rhythmically expressed mouse testicular lncRNAs from the 12-time-point dataset: Heat map (A), expression profiles (B), and phases (C) of all the 46 rhythmically expressed lncRNAs, and secondary structure plot of a representative lncRNA (D). (E-H) Analysis of 15 rhythmically expressed morning lncRNA: Heat map (E), expression profiles (F), and phases (G) of the 15 rhythmically expressed morning lncRNAs, and secondary structure plot of a representative lncRNA (H). (I-L) Analysis of 21 rhythmically expressed evening lncRNAs: Heat map (I), expression profiles (J), and phases (K) of the 21 rhythmically expressed evening lncRNAs, and secondary structure plot of a representative lncRNA (L). (M-P) Analysis of 10 rhythmically expressed night lncRNAs: Heat map (M), expression profiles (N), and phases (O) of the 10 rhythmically expressed night lncRNAs, and secondary structure plot of a representative evening lncRNA (P). |
Analyses of the 427 mouse testicular lncRNAs that lost rhythmicity in desynchronized conditions with data from both control and desynchronized conditions. (A, C) Heat map (A) and Biodare2 plot (C) of all the 427 lncRNAs with data from the 6-point-time control dataset. (B, D) Heat map (B) and Biodare2 plot (D) of all the 427 lncRNAs with data from the 6-point-time desynchronized dataset. (E) Expression profiles of top-ten representative lncRNAs from the control condition of the overall 427 lncRNAs. (F, H) Heatmap (F) and Biodare2 plot (H) of the 234 morning lncRNAs with data from the 6-point-time control dataset. (G, I) Heat map (G) and Biodare2 plot (I) of the 234 morning lncRNAs with data from the 6-point-time desynchronized dataset. (J) Expression profiles of top-ten representative lncRNAs from the control condition of the 234 morning lncRNAs. (K, M) Heat map (K) and Biodare2 plot (M) of the 104 evening lncRNAs with data from the 6-point-time control dataset. (L, N) Heatmap (L) and Biodare2 plot (N) of the 104 evening lncRNAs with data from the 6-point-time desynchronized dataset. (O) Expression profiles of top-ten representative lncRNAs from the control condition of the 104 evening lncRNAs. (P, R) Heat map (P) and Biodare2 plot (R) of the 89 night lncRNAs with data from the six-time-point control dataset. (Q, S) Heatmap (Q) and Biodare2 plot (S) of the 89 night lncRNAs with data from the 6-point-time desynchronized dataset. (T) Expression profiles from both control and desynchronized conditions of the top-ranked representative lncRNAs from the 89 night lncRNAs. |
Analyses of the 446 mouse testicular lncRNAs that gained rhythmicity in desynchronized conditions with data from both control and desynchronized conditions. (A, C) Heat map (A) and phases (C) of all the 446 lncRNAs from the 6-point-time control dataset. (B, D) Heat map (B) and phases (D) of all the 427 lncRNAs from the 6-point-time desynchronized dataset. (E) Expression profiles of top-ten representative lncRNAs from the desynchronized condition of the overall 446 lncRNAs. (F, H) Heat map (F) and phases (H) of the 174 morning lncRNAs from the 6-point-time control dataset. Heat map (G) and phases (I) of the 174 morning lncRNAs with data from the 6-point-time desynchronized dataset. (J) Expression profiles of top-ten representative lncRNAs from the desynchronized condition of the 174 morning lncRNAs. (K, M) Heat map (K) and phases (M) of the 196 evening lncRNAs with data from the 6-point-time control dataset. (L, N) Heat map (L) and phases (N) of the 196 evening lncRNAs with data from the 6-point-time desynchronized dataset. (O) Expression profiles of top-ten representative lncRNAs from the desynchronized condition of the 196 evening lncRNAs. (P, R) Heat map (P) and phases (R) of the 96 night lncRNAs with data from the 6-point-time control dataset. (Q, S) Heat map (Q) and phases (S) of the 96 night lncRNAs with data from the 6-point-time desynchronized dataset. (T) Expression profiles of top-ten representative lncRNAs from the desynchronized condition of the 196 night lncRNAs. |
Analyses of the 48 mouse testicular lncRNAs that maintained between the control and desynchronized conditions using the 6-point-time control and desynchronized datasets. (A, C) Heat map (A) and phases (C) of all the 48 lncRNAs from the 6-point-time control dataset. (B, D) Heat map (B) and phases (D) of all the 48 lncRNAs from the 6-point-time desynchronized dataset. (E) Expression profiles the top-five representative lncRNAs, each from both control (C) and desynchronized (D) conditions of the overall 48 lncRNAs. (F, H) Heat map (F) and phases (H) of the morning lncRNAs with data from the 6-point-time control dataset. (G, I) Heat map (G) and phases (I) of the morning lncRNAs with data from the 6-point-time desynchronized dataset. (J) Expression profiles of the top-five representative lncRNAs, each from both control (C) and desynchronized (D) conditions of the morning lncRNAs. (K, M) Heat map (K) and phases (M) of the evening lncRNAs with data from the 6-point-time control dataset. (L, N) Heat map (L) and phases (N) of the evening lncRNAs with data from the 6-point-time desynchronized dataset. (O) Expression profiles of the top-five representative lncRNAs, each from both control (C) and desynchronized (D) of the evening lncRNAs. (P, R) Heat map (P) and phases (R) of the night lncRNAs with data from the 6-point control dataset. (Q, S) Heat map () and phases (S) of the night lncRNAs with data from the 6-point desynchronized dataset. (O) Expression profiles of the top-five representative lncRNAs, each from both control (C) and desynchronized (D) conditions of the night lncRNAs. |
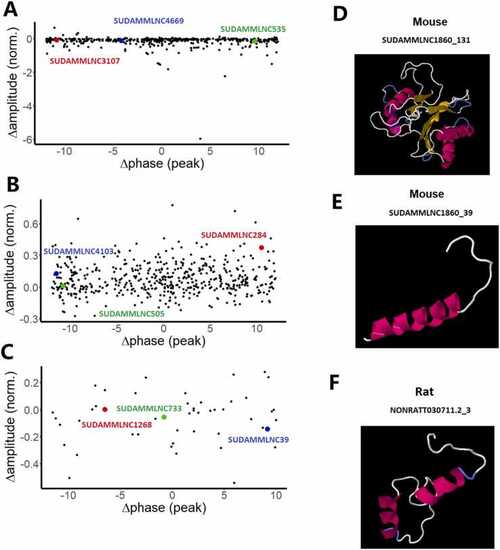
Visualization of changes of the phases and amplitudes of loss-of-rhythmicity, gain-of-rhythmicity, and rhythmicity-maintaining lncRNAs between control and desynchronized conditions, and 3-dimensional structures of the conserved lncRNA-encoded peptides. (A-C) Changes in the phases and amplitudes of loss-of-rhythmicity l mouse ncRNAs (A) and gain-of-rhythmicity mouse lncRNAs in the desynchronized condition (B), and rhythmicity-maintaining mouse lncRNAs between control and desynchronized conditions (C). (D-F) 3D models of peptides encoded by two mouse testicular lncRNAs (SUDAMMLNC1860_131, and SUDAMMLNC1860_39) (D, E) conserved with one rat lncRNA (NONRATT030711.2_3) (F). The predicted 3D models of the conserved lncRNA-encoded peptides revealed the presence of α-helix (pink or purple motif structure), β-strand (yellow layered band), and random coils (white or blue thread) with the known domains from Protein Data Bank, such as D (1g3kA), E (2axtL), and F (1g5cA). |