
Fig. 4
- ID
- ZDB-FIG-240111-45
- Publication
- Mishra et al., 2023 - Thousands of oscillating LncRNAs in the mouse testis
- Other Figures
- All Figure Page
- Back to All Figure Page
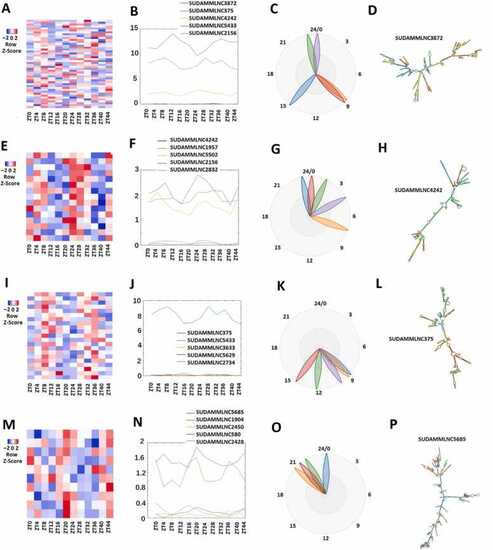
Analysis of 46 rhythmically expressed mouse testicular lncRNAs shared between the 12-point-time and 6-point-time control datasets using the 12-time-point data. (A-D) Analysis of all the 46 rhythmically expressed mouse testicular lncRNAs from the 12-time-point dataset: Heat map (A), expression profiles (B), and phases (C) of all the 46 rhythmically expressed lncRNAs, and secondary structure plot of a representative lncRNA (D). (E-H) Analysis of 15 rhythmically expressed morning lncRNA: Heat map (E), expression profiles (F), and phases (G) of the 15 rhythmically expressed morning lncRNAs, and secondary structure plot of a representative lncRNA (H). (I-L) Analysis of 21 rhythmically expressed evening lncRNAs: Heat map (I), expression profiles (J), and phases (K) of the 21 rhythmically expressed evening lncRNAs, and secondary structure plot of a representative lncRNA (L). (M-P) Analysis of 10 rhythmically expressed night lncRNAs: Heat map (M), expression profiles (N), and phases (O) of the 10 rhythmically expressed night lncRNAs, and secondary structure plot of a representative evening lncRNA (P). |