
Fig. 7
- ID
- ZDB-FIG-240111-48
- Publication
- Mishra et al., 2023 - Thousands of oscillating LncRNAs in the mouse testis
- Other Figures
- All Figure Page
- Back to All Figure Page
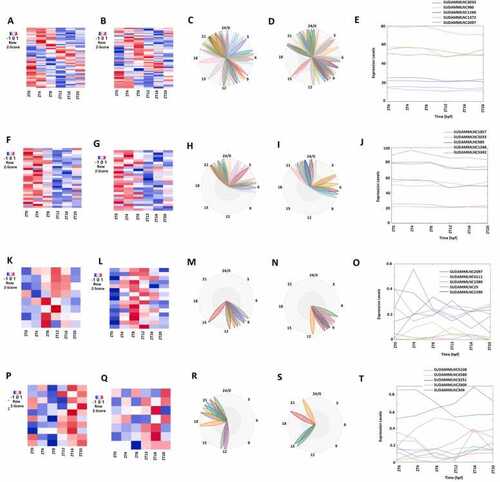
Analyses of the 48 mouse testicular lncRNAs that maintained between the control and desynchronized conditions using the 6-point-time control and desynchronized datasets. (A, C) Heat map (A) and phases (C) of all the 48 lncRNAs from the 6-point-time control dataset. (B, D) Heat map (B) and phases (D) of all the 48 lncRNAs from the 6-point-time desynchronized dataset. (E) Expression profiles the top-five representative lncRNAs, each from both control (C) and desynchronized (D) conditions of the overall 48 lncRNAs. (F, H) Heat map (F) and phases (H) of the morning lncRNAs with data from the 6-point-time control dataset. (G, I) Heat map (G) and phases (I) of the morning lncRNAs with data from the 6-point-time desynchronized dataset. (J) Expression profiles of the top-five representative lncRNAs, each from both control (C) and desynchronized (D) conditions of the morning lncRNAs. (K, M) Heat map (K) and phases (M) of the evening lncRNAs with data from the 6-point-time control dataset. (L, N) Heat map (L) and phases (N) of the evening lncRNAs with data from the 6-point-time desynchronized dataset. (O) Expression profiles of the top-five representative lncRNAs, each from both control (C) and desynchronized (D) of the evening lncRNAs. (P, R) Heat map (P) and phases (R) of the night lncRNAs with data from the 6-point control dataset. (Q, S) Heat map () and phases (S) of the night lncRNAs with data from the 6-point desynchronized dataset. (O) Expression profiles of the top-five representative lncRNAs, each from both control (C) and desynchronized (D) conditions of the night lncRNAs. |