
Fig. 3
- ID
- ZDB-FIG-240111-44
- Publication
- Mishra et al., 2023 - Thousands of oscillating LncRNAs in the mouse testis
- Other Figures
- All Figure Page
- Back to All Figure Page
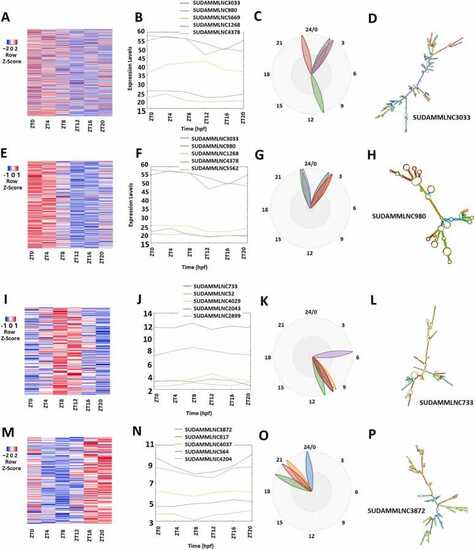
Analyses of 475 rhythmically expressed mouse testicular lncRNAs in the six-time-point control dataset measured over one day under light-dark (LD) conditions. (A-D) Analysis of all the 475 rhythmically expressed mouse testicular lncRNAs: Heat map (A) of all the 475 rhythmically expressed lncRNAs, expression profiles of representative lncRNAs (B) and phases of representative lncRNAs (C), and secondary structure plot (D) of a representative lncRNA. (E-H) Analysis of 264 morning lncRNAs: Heat map of the 264 morning lncRNAs (E), expression profiles of representative morning lncRNAs (F) and phases of representative morning lncRNAs (G), and secondary structure plot of a representative lncRNA (H). (I-L) Heat map of the 112 evening lncRNAs (I), expression profiles of representative evening lncRNAs (J) and phases of representative evening lncRNAs (K), and secondary structure plot of a representative evening lncRNA (L). (M-P) Heat map of the 99 night lncRNAs (M), expression profiles of representative evening lncRNAs (N) and phases of representative night lncRNAs (O), and secondary structure plot of a representative night lncRNA (P). |