
Fig. 5
- ID
- ZDB-FIG-240111-46
- Publication
- Mishra et al., 2023 - Thousands of oscillating LncRNAs in the mouse testis
- Other Figures
- All Figure Page
- Back to All Figure Page
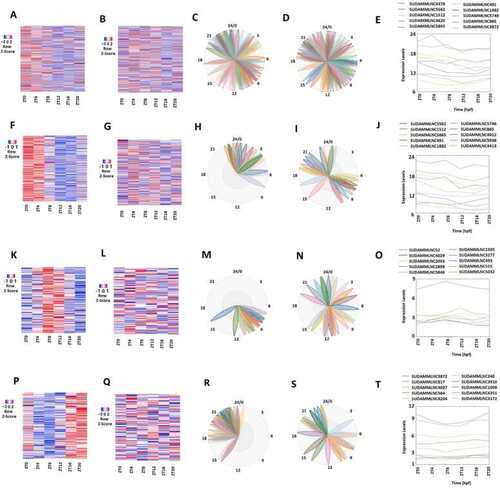
Analyses of the 427 mouse testicular lncRNAs that lost rhythmicity in desynchronized conditions with data from both control and desynchronized conditions. (A, C) Heat map (A) and Biodare2 plot (C) of all the 427 lncRNAs with data from the 6-point-time control dataset. (B, D) Heat map (B) and Biodare2 plot (D) of all the 427 lncRNAs with data from the 6-point-time desynchronized dataset. (E) Expression profiles of top-ten representative lncRNAs from the control condition of the overall 427 lncRNAs. (F, H) Heatmap (F) and Biodare2 plot (H) of the 234 morning lncRNAs with data from the 6-point-time control dataset. (G, I) Heat map (G) and Biodare2 plot (I) of the 234 morning lncRNAs with data from the 6-point-time desynchronized dataset. (J) Expression profiles of top-ten representative lncRNAs from the control condition of the 234 morning lncRNAs. (K, M) Heat map (K) and Biodare2 plot (M) of the 104 evening lncRNAs with data from the 6-point-time control dataset. (L, N) Heatmap (L) and Biodare2 plot (N) of the 104 evening lncRNAs with data from the 6-point-time desynchronized dataset. (O) Expression profiles of top-ten representative lncRNAs from the control condition of the 104 evening lncRNAs. (P, R) Heat map (P) and Biodare2 plot (R) of the 89 night lncRNAs with data from the six-time-point control dataset. (Q, S) Heatmap (Q) and Biodare2 plot (S) of the 89 night lncRNAs with data from the 6-point-time desynchronized dataset. (T) Expression profiles from both control and desynchronized conditions of the top-ranked representative lncRNAs from the 89 night lncRNAs. |