
|
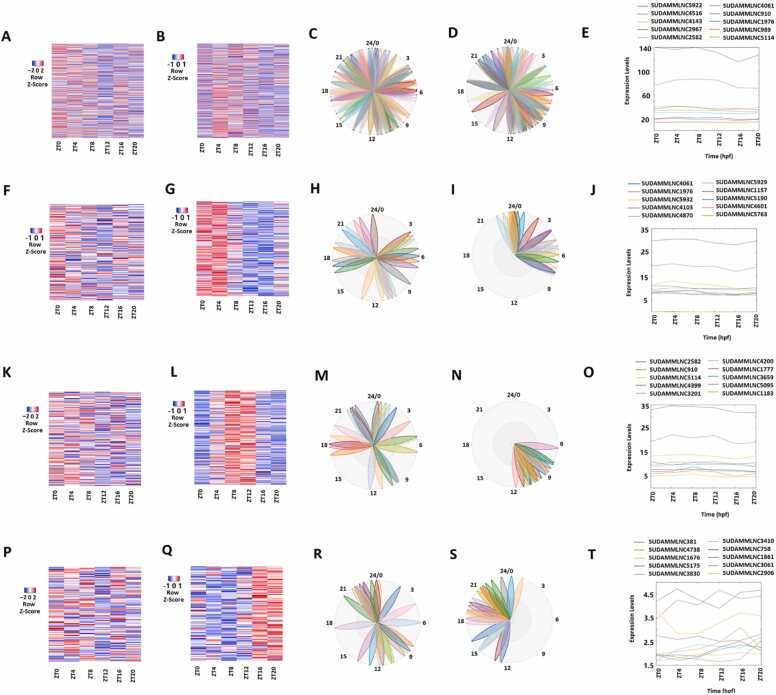
Fig. 6
Analyses of the 446 mouse testicular lncRNAs that gained rhythmicity in desynchronized conditions with data from both control and desynchronized conditions. (A, C) Heat map (A) and phases (C) of all the 446 lncRNAs from the 6-point-time control dataset. (B, D) Heat map (B) and phases (D) of all the 427 lncRNAs from the 6-point-time desynchronized dataset. (E) Expression profiles of top-ten representative lncRNAs from the desynchronized condition of the overall 446 lncRNAs. (F, H) Heat map (F) and phases (H) of the 174 morning lncRNAs from the 6-point-time control dataset. Heat map (G) and phases (I) of the 174 morning lncRNAs with data from the 6-point-time desynchronized dataset. (J) Expression profiles of top-ten representative lncRNAs from the desynchronized condition of the 174 morning lncRNAs. (K, M) Heat map (K) and phases (M) of the 196 evening lncRNAs with data from the 6-point-time control dataset. (L, N) Heat map (L) and phases (N) of the 196 evening lncRNAs with data from the 6-point-time desynchronized dataset. (O) Expression profiles of top-ten representative lncRNAs from the desynchronized condition of the 196 evening lncRNAs. (P, R) Heat map (P) and phases (R) of the 96 night lncRNAs with data from the 6-point-time control dataset. (Q, S) Heat map (Q) and phases (S) of the 96 night lncRNAs with data from the 6-point-time desynchronized dataset. (T) Expression profiles of top-ten representative lncRNAs from the desynchronized condition of the 196 night lncRNAs.