
|
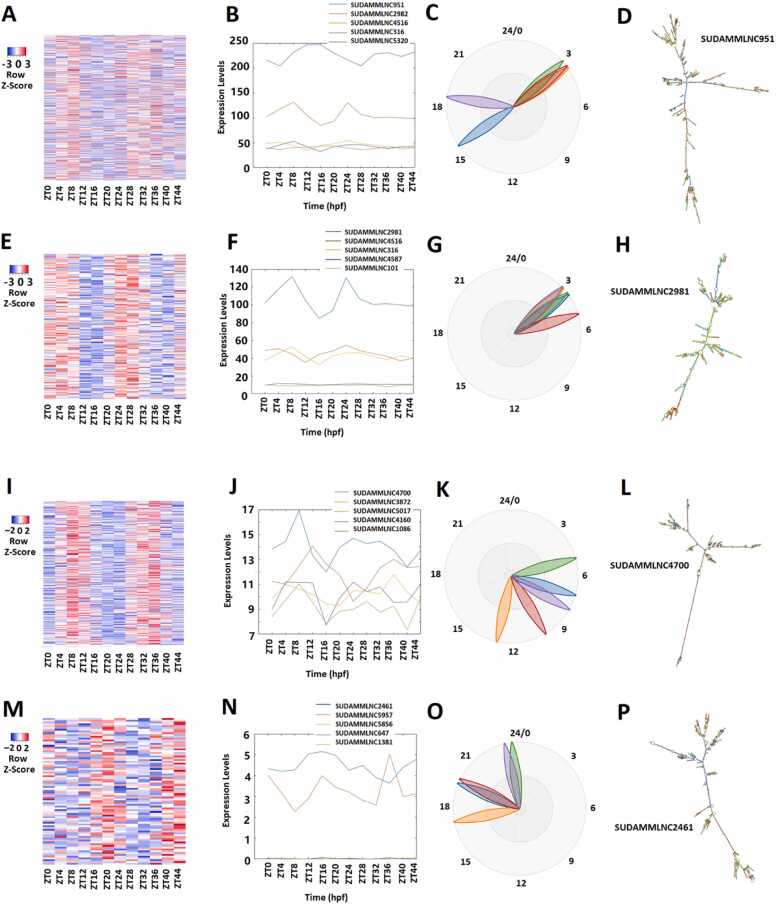
Fig. 1
Analyses of 519 rhythmically expressed mouse testicular lncRNAs in the 12-time-point dataset measured over two consecutive days under light/dark (LD) conditions. (A-D) Analysis of all the 519 rhythmically expressed mouse testicular lncRNAs: Heat map (A) of all the 519 rhythmically expressed lncRNAs, expression profiles (B) and phases (C) of representative lncRNAs, and secondary structure plot of a representative lncRNA (D). (E-H) Analysis of 171 morning lncRNAs: Heat map of the 171 morning lncRNAs (E), expression profiles (F) and phases (G) of representative morning lncRNAs, and secondary structure plot of a representative lncRNA (H). (I-L) Analysis of 266 evening lncRNAs: Heat map of the 266 evening lncRNAs (I), expression profiles (J) and phases (K) of representative evening lncRNAs, and secondary structure plot of a representative evening lncRNA (L). (M-P) Analysis of 82 night lncRNAs: Heat map of the 82 night lncRNAs (M), expression profiles (N) and phases (O) of representative evening lncRNAs, and secondary structure plot of a representative night lncRNA (P).