FIGURE SUMMARY
Title

Molecular blueprints for spinal circuit modules controlling locomotor speed in zebrafish

Authors
Pallucchi, I., Bertuzzi, M., Madrid, D., Fontanel, P., Higashijima, S.I., El Manira, A.
Source
Full text @ Nat. Neurosci.

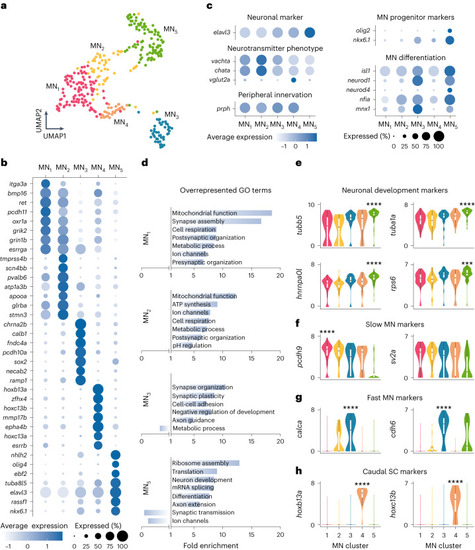
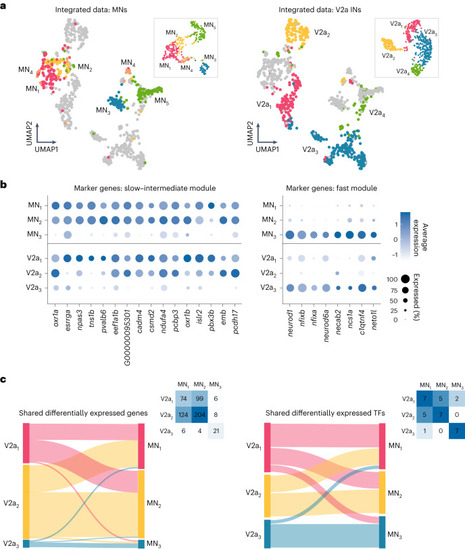
Molecular characterization of MN diversity.

a, MN single-cell transcriptomes visualized using UMAP of five color-coded, molecularly defined clusters (n = 316 cells; MN1, n = 98; MN2, n = 51; MN3, n = 47; MN4, n = 27; MN5, n = 93). b, Examples of differentially expressed genes in each cluster. The size of the circle reflects the proportion (%) of cells expressing the gene, and the color intensity reflects its average expression level within that cluster. c, Normalized expression levels for motoneuronal marker genes. d, GO analysis of differentially expressed genes in each cluster. e, Log-normalized gene expression levels for neuronal development gene markers (differential gene expression analysis, nonparametric Wilcoxon rank sum test with Bonferroni adjusted P value, ***P = 0.0003, ****P < 0.0001). f, Log-normalized expression levels of known gene markers of slow MNs in zebrafish (pcdh9) or mice (sv2a) (differential gene expression analysis, nonparametric Wilcoxon rank sum test with Bonferroni adjusted P value, ****P < 0.0001). g, Log-normalized expression levels of known gene markers of fast MNs in mice (differential gene expression analysis, nonparametric Wilcoxon rank sum test with Bonferroni adjusted P value, ****P < 0.0001). h, Log-normalized expression levels for caudal spinal cord (SC) gene markers (differential gene expression analysis, nonparametric Wilcoxon rank sum test with Bonferroni adjusted P value, ****P < 0.0001). In eh, boxes are bound by 25th and 75th percentiles, center line indicates the median and whiskers extend from minimum to maximum.

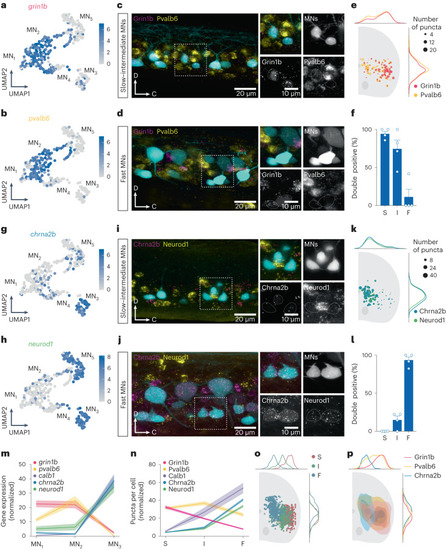
Validation of new molecular markers for MN subtypes.

a, UMAP of log-normalized expression of grin1b in MN clusters. b, UMAP of log-normalized expression of pvalb6 in MN clusters. c, Lateral view of a spinal cord segment showing RNAscope in situ hybridization of grin1b and pvalb6 in slow–intermediate MNs. d, RNAscope in situ hybridization of grin1b and pvalb6 in fast MNs. e, Normalized soma position of Grin1b+ and Pvalb6+ MNs in the spinal cord, coronal view of one side. The size of the circles reflects the number of puncta per cell (n = 4 animals). f, Graph showing the percentage of slow (S), intermediate (I) and fast (F) MNs coexpressing grin1b and pvalb6 (mean ± s.e.m., n = 4 animals). g, UMAP of log-normalized expression of chrna2b in MN clusters. h, UMAP of log-normalized expression of neurod1 in MN clusters. i, Lateral view of a spinal cord segment showing RNAscope in situ hybridization of chrna2b and neurod1 in slow–intermediate MNs. j, RNAscope in situ hybridization of chrna2b and neurod1 in fast MNs. k, Normalized soma position of Chrna2b+ and Neurod1+ MNs in a coronal section of the spinal cord (n = 4 animals). l, Percentage of S, I and F MNs coexpressing chrna2b and neurod1 (mean ± s.e.m., n = 4 animals). m, Normalized and averaged expression of grin1b, pvalb6, calb1, chrna2b and neurod1 in MN clusters (MN1–3) (mean ± s.e.m.). n, Normalized and averaged number of puncta in Grin1b+, Pvalb6+, Calb1+, Chrna2b+ and Neurod1+ in S, I and F MNs (mean ± s.e.m.; n = 4 animals). o, Soma position of S, I and F MNs. p, Spatial distribution of Grin1b+, Pvalb6+ and Chrna2b+ MNs.

Source data

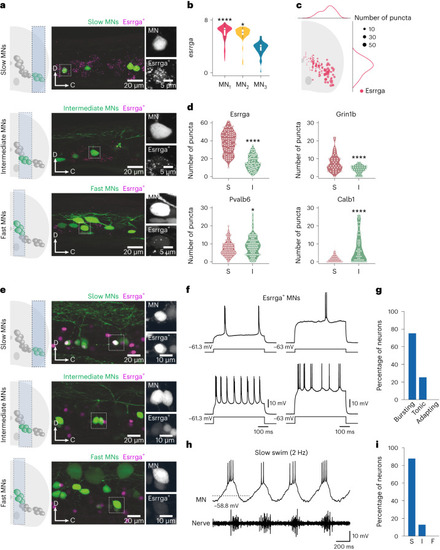
Characterization of Esrrga+ MNs.

a, Lateral view of a spinal cord segment showing RNAscope in situ hybridization of esrrga in retrogradely labeled slow, intermediate and fast MNs. b, Violin plot of log-normalized expression of esrrga in the three MN clusters (MN1, n = 98; MN2, n = 51; MN3, n = 47; differential gene expression analysis, nonparametric Wilcoxon rank sum test with Bonferroni adjusted P value, *P = 0.014, ****P < 0.0001; boxes are bound by the 25th and 75th percentiles, the center line indicates the median and whiskers extend from minimum to maximum). c, Normalized distribution of Esrrga+ MNs in the spinal cord. d, Violin plots of the number of puncta of esrrga (n = 8 animals), grin1b (n = 9 animals), pvalb6 (n = 9 animals) and calb1 (n = 9 animals) in slow (S) and intermediate (I) MNs (two-tailed Mann–Whitney U test; *P = 0.0281, ***P = 0.0003, ****P < 0.0001). e, Lateral view of a spinal cord segment showing the expression of a fluorescence reporter driven by esrrga in a transgenic line in slow, intermediate and fast MNs. f, Two examples of Esrrga+ MNs firing in bursts of action potentials in response to depolarizing current injections. g, Percentage of Esrrga+ MNs with bursting, tonic and adapting firing patterns (n = 16 neurons). h, Recruitment of an Esrrga+ MN at slow swim frequencies. i, Percentage of Esrrga+ MNs recruited at slow (S), intermediate (I) or fast (F) swim frequencies (n = 16 neurons).

Source data

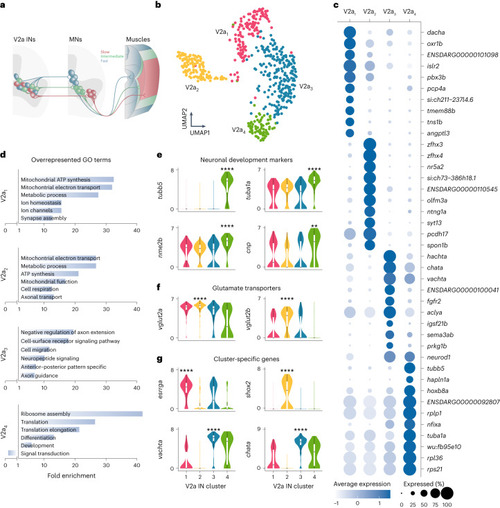
Molecular characterization of V2a IN diversity.

a, Schematic showing the soma position and connectivity pattern of V2a INs and MNs in the spinal cord as well as the innervation and organization of axial muscles in adult zebrafish. b, V2a INs single-cell transcriptomes visualized with UMAP, color-coded for four molecularly defined clusters (V2a1–4, n = 593 cells; V2a1, n = 137; V2a2, n = 125; V2a3, n = 221; V2a4, n = 77). c, Examples of differentially expressed genes in each cluster. The size of the circle reflects the proportion (%) of the cells expressing the gene in a cluster, and the color intensity reflects its average expression level within that cluster. d, GO analysis of differentially expressed genes in each cluster. e, Log-normalized expression of neuronal development gene markers (differential gene expression analysis, nonparametric Wilcoxon rank sum test with Bonferroni adjusted P value, **P = 0.0027, ****P < 0.0001). f, Log-normalized expression of glutamate transporter genes (differential gene expression analysis, nonparametric Wilcoxon rank sum test with Bonferroni adjusted P value, ****P < 0.0001). g, Log-normalized expression of selected gene markers for each cluster (differential gene expression analysis, nonparametric Wilcoxon rank sum test with Bonferroni adjusted P value, ****P < 0.0001). In eg, boxes are bound by the 25th and 75th percentiles, the center line indicates the median and whiskers extend from minimum to maximum.

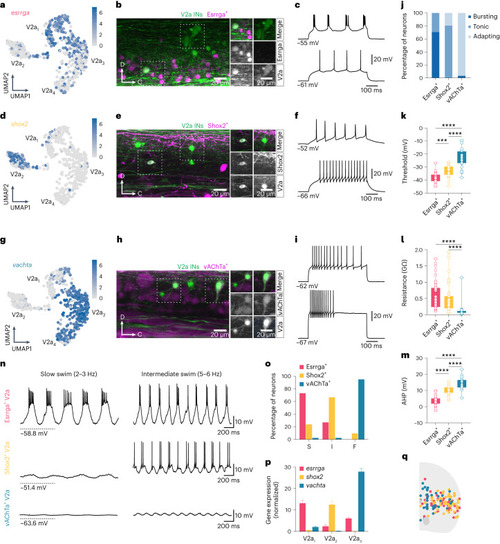
Electrophysiological and functional validation of V2a IN molecular clusters.

a, UMAP of log-normalized expression of esrrga in V2a IN clusters. b, Expression of Essrga and Chx10 in a spinal segment. c, Examples of bursting (top) or tonic (bottom) firing Esrrga+ V2a INs. d, UMAP log-normalized expression of shox2 in V2a IN clusters. e, Expression of Shox2 and Chx10 in a spinal segment. f, Examples of tonic firing Shox2+ V2a INs. g, UMAP log-normalized expression of vachta in V2a IN clusters. h, Expression of vAChTa and Chx10 in a spinal segment. i, Examples of adapting firing vAChTa+ V2a INs. j, Percentage of Esrrga+, Shox2+ or vAChTa+ V2a INs with bursting, tonic or adapting firing (n = 43 Esrrga+, n = 53 Shox2+; n = 28 vAChTa+ V2a INs). k, Firing threshold of the three V2a INs subtypes (one-way ANOVA with Tukey’s post hoc multiple comparisons, ***P = 0.0009 ****P < 0.0001; n = 23 vAChTa+; 28 Shox2+; 32 Esrrga+ V2a INs). l, Input resistance of the three V2a INs subtypes (Kruskal–Wallis test with Dunn’s post hoc multiple comparisons, ****P < 0.0001; n = 44 vAChTa+; n = 47 Shox2+; n = 47 Esrrga+ V2a INs). m, AHP amplitude of the three V2a INs subtypes (one-way ANOVA with Tukey’s post hoc multiple comparisons, ****P < 0.0001; n = 23 vAChTa+; n = 34 Shox2+; n = 30 Esrrga+ V2a INs). n, Top, an Esrrga+ V2a IN recruited at slow and intermediate swim frequencies. Middle, a Shox2+ V2a IN recruited at intermediate swim frequencies. Bottom, a vAChTa+ V2a IN not recruited at slow and intermediate swim frequencies. o, Percentage of Esrrga+, Shox2+ or vAChTa+ V2a INs identified as slow (S), intermediate (I) or fast (F) (n = 31 Esrrga+, n = 40 Shox2+; n = 38 vAChTa+ V2a INs). p, Averaged expression esrrga, shox2 and vachta in V2a IN clusters (mean ± s.e.m.; V2a1: n = 137; V2a2: n = 125; V2a3: n = 221). q, Soma position of Esrrga+, Shox2+ and vAChTa+ V2a INs. In km, boxes are bound by the 25th and 75th percentiles and whiskers extend from minimum to maximum.

Source data

Shared features of functional speed modules across spinal populations

a, Left, UMAP of the MN and V2a IN integrated dataset, color-coded for original MN clusters (inset). Right, UMAP of the integrated dataset, color-coded for original V2a IN clusters (inset). b, List of differentially expressed genes in the different circuit modules. Left, slow and intermediate modules; right, fast module. The size of the circle reflects the proportion (%) of the cells expressing the gene in a cluster, and the color intensity reflects its average expression level within that cluster. c, Top, Sankey plot of overall differentially expressed genes (left) and differentially expressed TFs (right) shared by different modules of V2a IN and MN clusters. Insets, data are presented as a heatmap with number of genes.

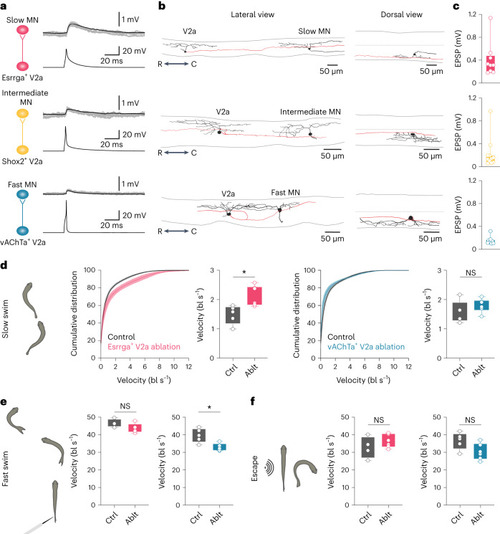
Functional connectivity between transcriptomically defined V2a IN and MN subtypes.

a, Monosynaptic connections between presynaptic Esrrga+ (top), Shox2+ (middle) or vAChTa+ (bottom) V2a INs and postsynaptic slow/Esrrga+, intermediate or fast MNs, respectively. b, Morphological reconstruction of the connected V2a IN–MN pairs (black, soma and dendrites; red, V2a IN axons). c, EPSP amplitude of V2a IN–MN connected pairs of each module (n = 9, top; n = 11, middle; n = 9, bottom). d, Two-photon ablation of slow/Esrrga+ but not of fast/vAChTa+ V2a INs affected slow explorative swimming. Graphs show the cumulative distribution or average swimming velocity in control (Ctrl) and zebrafish with ablated (Ablt) slow/Esrrga+ (magenta, left) or fast/vAChTa+ (blue, right) V2a INs (mean ± s.e.m.; two-tailed Student’s t-test, *P = 0.0111; Esrrga+ V2a IN ablation, n = 5 controls and n = 6 ablated; vAChTa+ V2a IN ablation, n = 6 controls and n = 6 ablated; bl, body length). e, Two-photon ablation of fast/vAChTa+ (blue, right), but not slow/Esrrga+ (magenta, left) V2a INs affected touch-induced fast swimming (mean ± s.e.m.; two-tailed Student’s t-test, *P = 0.0102; Esrrga+ V2a IN ablation, n = 5 controls and n = 6 ablated; vAChTa+ V2a IN ablation, n = 6 controls and n = 6 ablated). f, Sound-induced escape behavior was not affected by ablation of slow/Esrrga+ (magenta, left) or fast/vAChTa+ (blue, right) V2a INs (mean ± s.e.m.; two-tailed Student’s t-test, P > 0.05; Esrrga+ V2a IN ablation, n = 5 controls and n = 6 ablated; vAChTa+ V2a IN ablation, n = 6 controls and n = 6 ablated). In cf, boxes are bound by the 25th and 75th percentiles, whiskers extend from minimum to maximum.

Source data

Acknowledgments
This image is the copyrighted work of the attributed author or publisher, and ZFIN has permission only to display this image to its users. Additional permissions should be obtained from the applicable author or publisher of the image. Full text @ Nat. Neurosci.