IMAGE

Fig. 2

ID
ZDB-IMAGE-240110-2
Source
Figures for Pallucchi et al., 2023
Image
Figure Caption

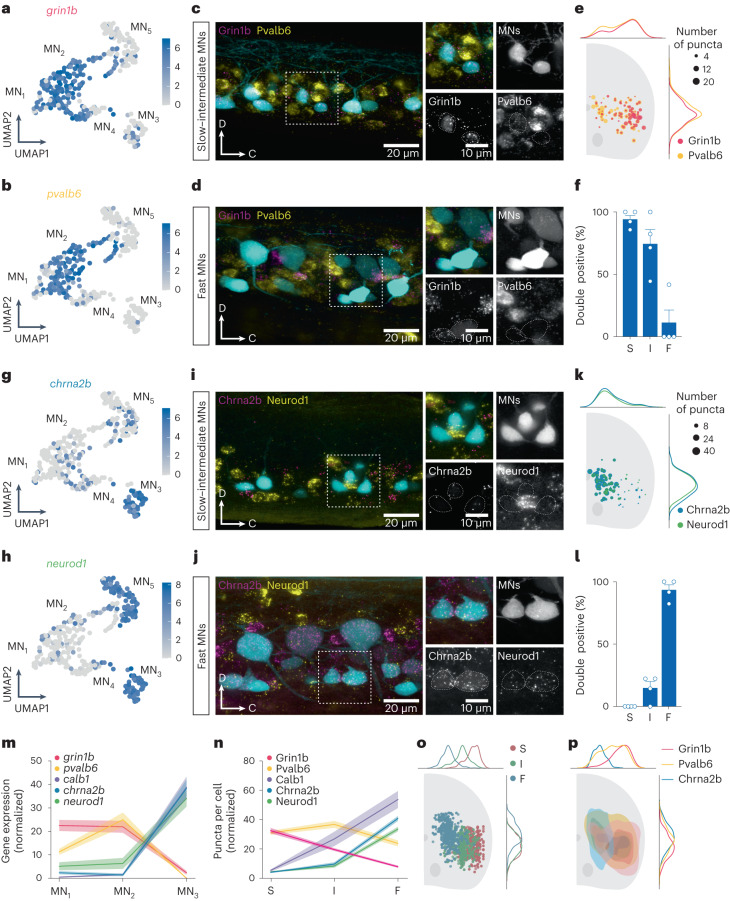
Fig. 2 Validation of new molecular markers for MN subtypes.

a, UMAP of log-normalized expression of grin1b in MN clusters. b, UMAP of log-normalized expression of pvalb6 in MN clusters. c, Lateral view of a spinal cord segment showing RNAscope in situ hybridization of grin1b and pvalb6 in slow–intermediate MNs. d, RNAscope in situ hybridization of grin1b and pvalb6 in fast MNs. e, Normalized soma position of Grin1b+ and Pvalb6+ MNs in the spinal cord, coronal view of one side. The size of the circles reflects the number of puncta per cell (n = 4 animals). f, Graph showing the percentage of slow (S), intermediate (I) and fast (F) MNs coexpressing grin1b and pvalb6 (mean ± s.e.m., n = 4 animals). g, UMAP of log-normalized expression of chrna2b in MN clusters. h, UMAP of log-normalized expression of neurod1 in MN clusters. i, Lateral view of a spinal cord segment showing RNAscope in situ hybridization of chrna2b and neurod1 in slow–intermediate MNs. j, RNAscope in situ hybridization of chrna2b and neurod1 in fast MNs. k, Normalized soma position of Chrna2b+ and Neurod1+ MNs in a coronal section of the spinal cord (n = 4 animals). l, Percentage of S, I and F MNs coexpressing chrna2b and neurod1 (mean ± s.e.m., n = 4 animals). m, Normalized and averaged expression of grin1b, pvalb6, calb1, chrna2b and neurod1 in MN clusters (MN1–3) (mean ± s.e.m.). n, Normalized and averaged number of puncta in Grin1b+, Pvalb6+, Calb1+, Chrna2b+ and Neurod1+ in S, I and F MNs (mean ± s.e.m.; n = 4 animals). o, Soma position of S, I and F MNs. p, Spatial distribution of Grin1b+, Pvalb6+ and Chrna2b+ MNs.

Source data

Acknowledgments
This image is the copyrighted work of the attributed author or publisher, and ZFIN has permission only to display this image to its users. Additional permissions should be obtained from the applicable author or publisher of the image. Full text @ Nat. Neurosci.