|
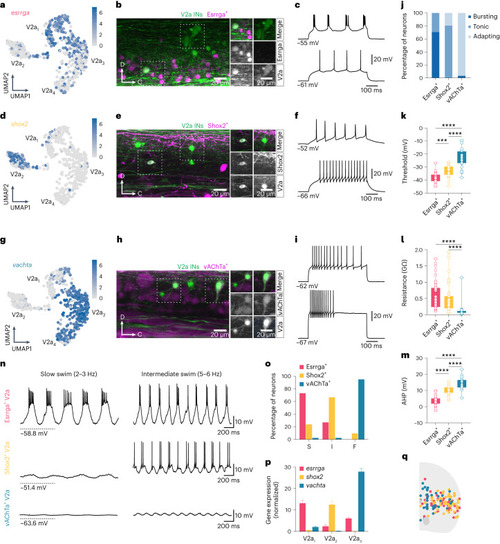
Electrophysiological and functional validation of V2a IN molecular clusters. a, UMAP of log-normalized expression of esrrga in V2a IN clusters. b, Expression of Essrga and Chx10 in a spinal segment. c, Examples of bursting (top) or tonic (bottom) firing Esrrga+ V2a INs. d, UMAP log-normalized expression of shox2 in V2a IN clusters. e, Expression of Shox2 and Chx10 in a spinal segment. f, Examples of tonic firing Shox2+ V2a INs. g, UMAP log-normalized expression of vachta in V2a IN clusters. h, Expression of vAChTa and Chx10 in a spinal segment. i, Examples of adapting firing vAChTa+ V2a INs. j, Percentage of Esrrga+, Shox2+ or vAChTa+ V2a INs with bursting, tonic or adapting firing (n = 43 Esrrga+, n = 53 Shox2+; n = 28 vAChTa+ V2a INs). k, Firing threshold of the three V2a INs subtypes (one-way ANOVA with Tukey’s post hoc multiple comparisons, ***P = 0.0009 ****P < 0.0001; n = 23 vAChTa+; 28 Shox2+; 32 Esrrga+ V2a INs). l, Input resistance of the three V2a INs subtypes (Kruskal–Wallis test with Dunn’s post hoc multiple comparisons, ****P < 0.0001; n = 44 vAChTa+; n = 47 Shox2+; n = 47 Esrrga+ V2a INs). m, AHP amplitude of the three V2a INs subtypes (one-way ANOVA with Tukey’s post hoc multiple comparisons, ****P < 0.0001; n = 23 vAChTa+; n = 34 Shox2+; n = 30 Esrrga+ V2a INs). n, Top, an Esrrga+ V2a IN recruited at slow and intermediate swim frequencies. Middle, a Shox2+ V2a IN recruited at intermediate swim frequencies. Bottom, a vAChTa+ V2a IN not recruited at slow and intermediate swim frequencies. o, Percentage of Esrrga+, Shox2+ or vAChTa+ V2a INs identified as slow (S), intermediate (I) or fast (F) (n = 31 Esrrga+, n = 40 Shox2+; n = 38 vAChTa+ V2a INs). p, Averaged expression esrrga, shox2 and vachta in V2a IN clusters (mean ± s.e.m.; V2a1: n = 137; V2a2: n = 125; V2a3: n = 221). q, Soma position of Esrrga+, Shox2+ and vAChTa+ V2a INs. In k–m, boxes are bound by the 25th and 75th percentiles and whiskers extend from minimum to maximum. Source data
|