|
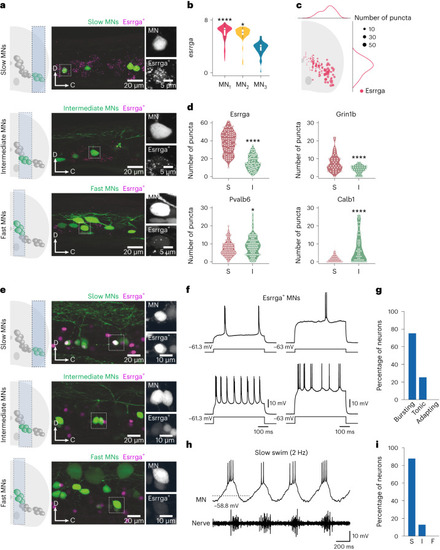
Characterization of Esrrga+ MNs. a, Lateral view of a spinal cord segment showing RNAscope in situ hybridization of esrrga in retrogradely labeled slow, intermediate and fast MNs. b, Violin plot of log-normalized expression of esrrga in the three MN clusters (MN1, n = 98; MN2, n = 51; MN3, n = 47; differential gene expression analysis, nonparametric Wilcoxon rank sum test with Bonferroni adjusted P value, *P = 0.014, ****P < 0.0001; boxes are bound by the 25th and 75th percentiles, the center line indicates the median and whiskers extend from minimum to maximum). c, Normalized distribution of Esrrga+ MNs in the spinal cord. d, Violin plots of the number of puncta of esrrga (n = 8 animals), grin1b (n = 9 animals), pvalb6 (n = 9 animals) and calb1 (n = 9 animals) in slow (S) and intermediate (I) MNs (two-tailed Mann–Whitney U test; *P = 0.0281, ***P = 0.0003, ****P < 0.0001). e, Lateral view of a spinal cord segment showing the expression of a fluorescence reporter driven by esrrga in a transgenic line in slow, intermediate and fast MNs. f, Two examples of Esrrga+ MNs firing in bursts of action potentials in response to depolarizing current injections. g, Percentage of Esrrga+ MNs with bursting, tonic and adapting firing patterns (n = 16 neurons). h, Recruitment of an Esrrga+ MN at slow swim frequencies. i, Percentage of Esrrga+ MNs recruited at slow (S), intermediate (I) or fast (F) swim frequencies (n = 16 neurons). Source data
|