IMAGE

Fig. 4

ID
ZDB-IMAGE-240110-5
Source
Figures for Pallucchi et al., 2023
Image
Figure Caption

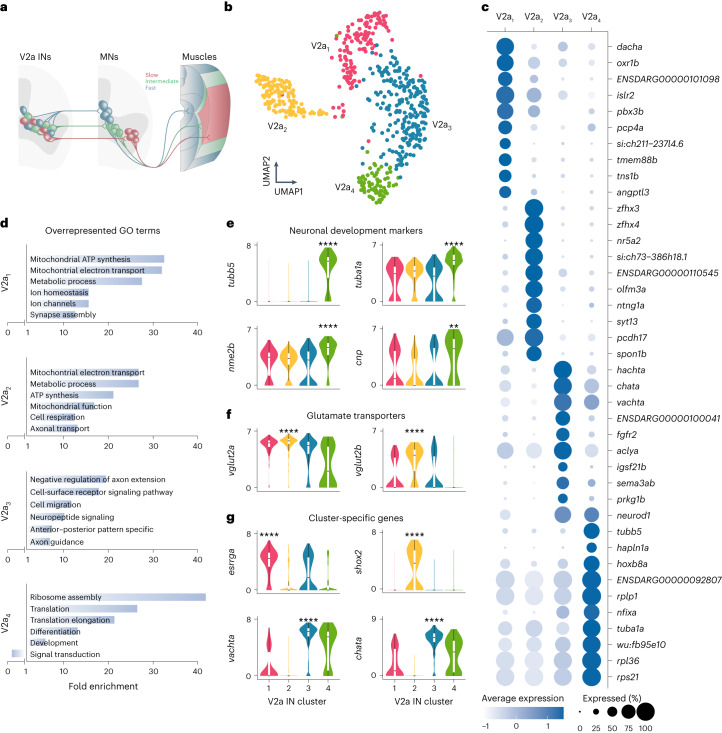
Fig. 4 Molecular characterization of V2a IN diversity.

a, Schematic showing the soma position and connectivity pattern of V2a INs and MNs in the spinal cord as well as the innervation and organization of axial muscles in adult zebrafish. b, V2a INs single-cell transcriptomes visualized with UMAP, color-coded for four molecularly defined clusters (V2a1–4, n = 593 cells; V2a1, n = 137; V2a2, n = 125; V2a3, n = 221; V2a4, n = 77). c, Examples of differentially expressed genes in each cluster. The size of the circle reflects the proportion (%) of the cells expressing the gene in a cluster, and the color intensity reflects its average expression level within that cluster. d, GO analysis of differentially expressed genes in each cluster. e, Log-normalized expression of neuronal development gene markers (differential gene expression analysis, nonparametric Wilcoxon rank sum test with Bonferroni adjusted P value, **P = 0.0027, ****P < 0.0001). f, Log-normalized expression of glutamate transporter genes (differential gene expression analysis, nonparametric Wilcoxon rank sum test with Bonferroni adjusted P value, ****P < 0.0001). g, Log-normalized expression of selected gene markers for each cluster (differential gene expression analysis, nonparametric Wilcoxon rank sum test with Bonferroni adjusted P value, ****P < 0.0001). In eg, boxes are bound by the 25th and 75th percentiles, the center line indicates the median and whiskers extend from minimum to maximum.

Acknowledgments
This image is the copyrighted work of the attributed author or publisher, and ZFIN has permission only to display this image to its users. Additional permissions should be obtained from the applicable author or publisher of the image. Full text @ Nat. Neurosci.