IMAGE

Fig. 1

ID
ZDB-IMAGE-240110-3
Source
Figures for Pallucchi et al., 2023
Image
Figure Caption

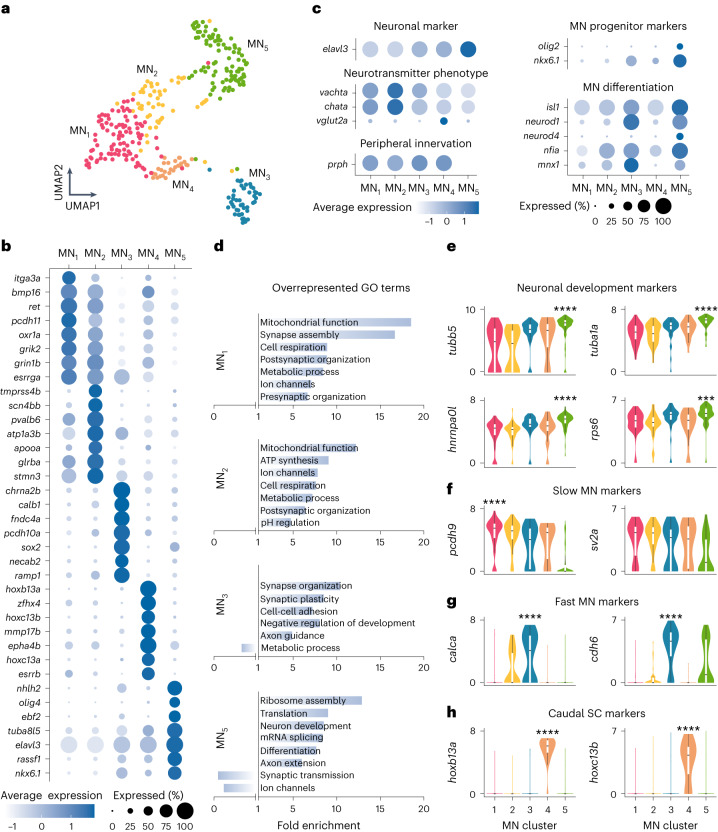
Fig. 1 Molecular characterization of MN diversity.

a, MN single-cell transcriptomes visualized using UMAP of five color-coded, molecularly defined clusters (n = 316 cells; MN1, n = 98; MN2, n = 51; MN3, n = 47; MN4, n = 27; MN5, n = 93). b, Examples of differentially expressed genes in each cluster. The size of the circle reflects the proportion (%) of cells expressing the gene, and the color intensity reflects its average expression level within that cluster. c, Normalized expression levels for motoneuronal marker genes. d, GO analysis of differentially expressed genes in each cluster. e, Log-normalized gene expression levels for neuronal development gene markers (differential gene expression analysis, nonparametric Wilcoxon rank sum test with Bonferroni adjusted P value, ***P = 0.0003, ****P < 0.0001). f, Log-normalized expression levels of known gene markers of slow MNs in zebrafish (pcdh9) or mice (sv2a) (differential gene expression analysis, nonparametric Wilcoxon rank sum test with Bonferroni adjusted P value, ****P < 0.0001). g, Log-normalized expression levels of known gene markers of fast MNs in mice (differential gene expression analysis, nonparametric Wilcoxon rank sum test with Bonferroni adjusted P value, ****P < 0.0001). h, Log-normalized expression levels for caudal spinal cord (SC) gene markers (differential gene expression analysis, nonparametric Wilcoxon rank sum test with Bonferroni adjusted P value, ****P < 0.0001). In eh, boxes are bound by 25th and 75th percentiles, center line indicates the median and whiskers extend from minimum to maximum.

Acknowledgments
This image is the copyrighted work of the attributed author or publisher, and ZFIN has permission only to display this image to its users. Additional permissions should be obtained from the applicable author or publisher of the image. Full text @ Nat. Neurosci.