IMAGE

Fig. 6

ID
ZDB-IMAGE-240110-7
Source
Figures for Pallucchi et al., 2023
Image
Figure Caption

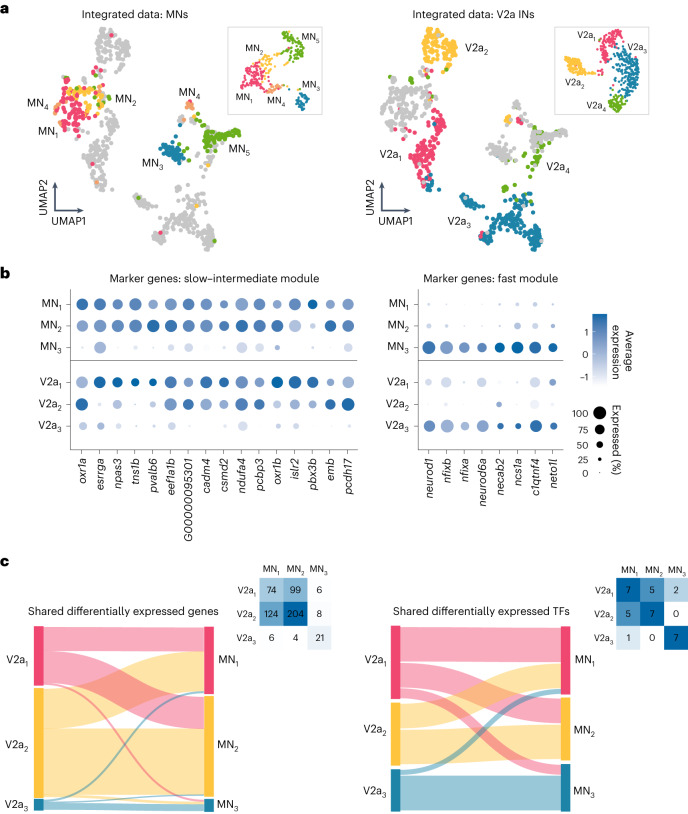
Fig. 6 Shared features of functional speed modules across spinal populations

a, Left, UMAP of the MN and V2a IN integrated dataset, color-coded for original MN clusters (inset). Right, UMAP of the integrated dataset, color-coded for original V2a IN clusters (inset). b, List of differentially expressed genes in the different circuit modules. Left, slow and intermediate modules; right, fast module. The size of the circle reflects the proportion (%) of the cells expressing the gene in a cluster, and the color intensity reflects its average expression level within that cluster. c, Top, Sankey plot of overall differentially expressed genes (left) and differentially expressed TFs (right) shared by different modules of V2a IN and MN clusters. Insets, data are presented as a heatmap with number of genes.

Acknowledgments
This image is the copyrighted work of the attributed author or publisher, and ZFIN has permission only to display this image to its users. Additional permissions should be obtained from the applicable author or publisher of the image. Full text @ Nat. Neurosci.