FIGURE SUMMARY
Title

Lineage tracing identifies heterogeneous hepatoblast contribution to cell lineages and postembryonic organ growth dynamics

Authors
Unterweger, I.A., Klepstad, J., Hannezo, E., Lundegaard, P.R., Trusina, A., Ober, E.A.
Source
Full text @ PLoS Biol.

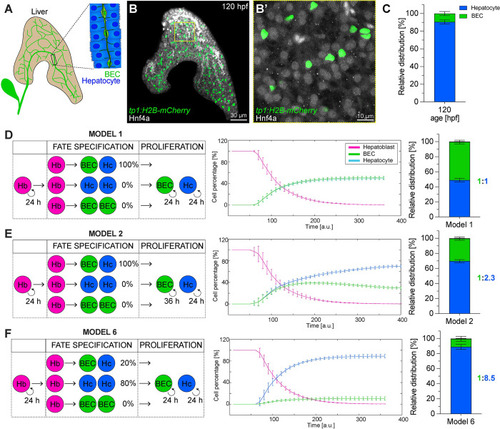
Establishment of BEC and hepatocyte lineages: in vivo cell type quantification and in silico modelling

(A) Schematic of a 5-dpf liver, highlighting the biliary network. (B-B’) Maximum projection (200 μm z-stack) of a 120-hpf liver expressing tp1:H2B-mCherry (BEC) and stained for Hnf4ɑ (hepatocyte). Autofluorescent blood cells appear in bright white. (N = 4, n ≥ 12 livers) (C) Relative distribution of BECs and hepatocytes at 120 hpf (N = 4, n ≥ 12 livers). (D-F) Mathematical models simulating hepatoblast differentiation employing different parameter combinations: proliferation rates of differentiated cell types is equal (D, F) or slower in BECs (E). Hepatoblasts either are all bipotent (D, E) or represent a heterogeneous population with mixed probabilities for uni-or bipotent differentiation (F). Plots showing the simulated cell proportions over simulation time (n = 10) and the final cell type ratio in bar graphs. The numerical values that were used to generate the graphs in (C-F) can be found in S1 Data. BEC, biliary epithelial cell; dpf, day postfertilization; Hb, hepatoblast; Hc, hepatocyte; hpf, hours post fertilization.

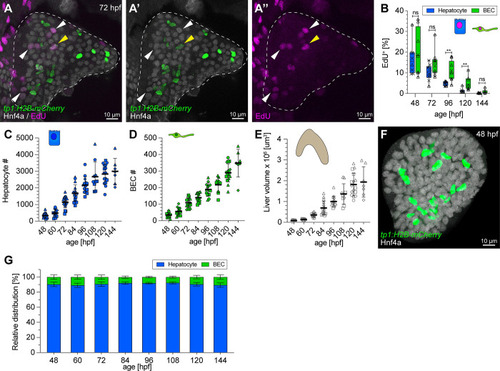
Hepatic proliferation dynamics and early establishment of a 1:9 BEC:hepatocyte ratio during embryonic development.

(A) Approximately 5 μm projection of a 72-hpf liver expressing tp1:H2B-mCherry (BEC), stained for Hnf4a (hepatocytes) and EdU (proliferating cells). Yellow and white arrowheads highlight proliferating BECs and hepatocytes, respectively (N = 2, n = 10 livers). (B) Graph showing the proportion of EdU+ proliferating hepatocytes and BECs over time (N = 2, n ≥ 8). (C, D) Graph showing hepatocyte (C) and BEC (D) cell numbers during development (N = 4, n ≥ 12 livers). (E) Quantification of total liver volume during development determined in embryos in BABB (N = 4, n ≥ 12 livers). (F) Maximum projection (20 μm z-stacks) of a 48-hpf liver expressing tp1:H2B-mCherry (BEC) and stained for Hnf4ɑ (hepatocyte). (G) Relative distribution of BECs and hepatocytes during development from 48 to 144 hpf (N = 4, n ≥ 12 livers). (B-E) Different shape data points indicate different experiments. The numerical values that were used to generate the graphs in (B-E, G) can be found in S1 Data. BEC, biliary epithelial cell; EdU, 5-ethynyl-2′-deoxyuridine; hpf, hours post fertilization.

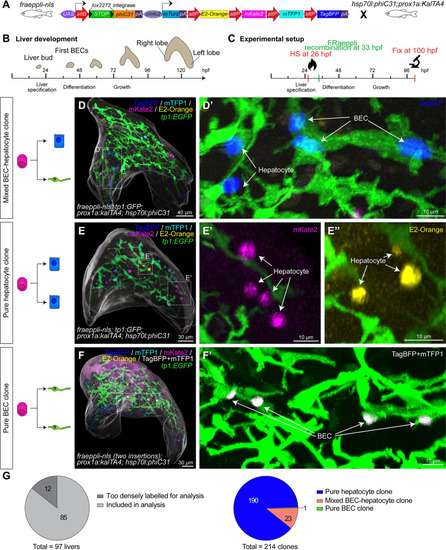
Quantitative lineage tracing identifies uni- and bipotent hepatoblast contributions during lineage decisions.

(A) Schematic of FRaeppli-NLS cassette including attB and attP sites for PhiC31-mediated recombination and the 4 FRaeppli FPs: TagBFP, mTFP1, mKate2, and E2-Orange. Recombination is induced by combining fraeppli-nls with hsp70l:phiC31; prox1a:kalTA4; see S3A Fig. (B) Key steps of liver development in zebrafish: After hepatoblast specification, the differentiation into BECs and hepatocytes is initiated at around 42 hpf. Differentiated cells acquire polarity and form a functional architecture by 120 hpf. (C) Experimental strategy for tracing progeny of individual hepatoblasts using fraeppli-nls: Heat shock at 26 hpf controls PhiC31 expression followed by attB-attP recombination. Embryos were fixed at 100 hpf for analysis. (D-F) Whole-mount livers at 100 hpf showing (D) mixed clone composed of hepatocytes and BECs (D’) (N = 6, n = 23 clones); (E) clones formed by pure hepatocytes (E’-E”) (N = 6, n = 190 clones); and (F) example of pure BEC clone coexpressing TagBFP and mTFP1 (white, coexpressing cells were manually segmented and masked). (F’) (N = 2, n = 2 clones). (D-F) An overall segmentation of the whole liver tissue is shown in transparent grey. (G) Pie charts showing the total number of labelled embryos and clones with manually assigned lineage contributions (N = 6, n = 214 clones; in 2 of the 6 experiments, nuclear shape indicated BEC fate). The numerical values that were used to generate the graphs in (G) can be found in S1 Data. BEC, biliary epithelial cell; FP, fluorescent protein; hpf, hours post fertilization.

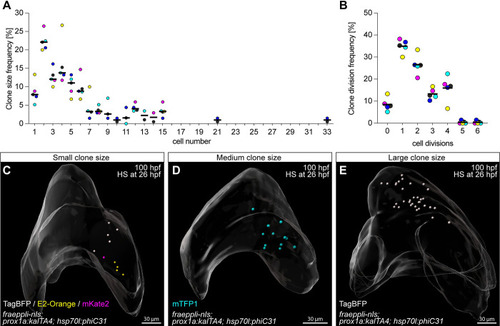
Quantitative lineage tracing of hepatoblasts during embryonic development identifies heterogeneous growth behaviour.

(A) Frequency of manually assigned pure hepatocyte clone sizes (N = 6, n = 190 clones). (B) Distribution of the corresponding number of cell divisions for each pure hepatocyte clone (N = 6, n = 190 clones). (A, B) Clone colours are plotted in blue (TagBFP), turquoise (mTFP1), magenta (mKate2), and orange (E2-Orange); the mean of all colours is represented in black. (C) Whole-mount of a 100-hpf liver showing several clones, including a mKate2+ 1-cell clone (N = 6, n = 15 livers). (D) Liver with a medium size 12-cell mTFP1+ clone (N = 6, n = 7 livers). (E) Whole-mount of a 100-hpf liver with a large 33-cell TagBFP+ clone (N = 1, n = 1 livers). (C-E) Labelled cells are represented as segmented nuclei, and an overall segmentation of the whole liver tissue is shown in transparent grey. The numerical values that were used to generate the graphs in (A, B) can be found in S1 Data.

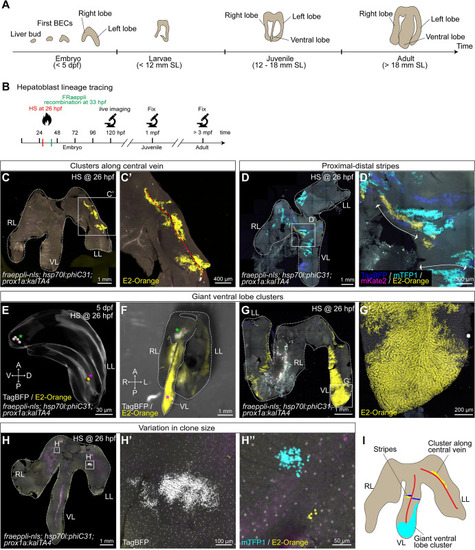
Lineage tracing reveals heterogeneous cluster topologies during postembryonic growth.

(A) Schematic depicting key stages in postembryonic zebrafish liver development. (B) Experimental schematics of long-term lineage tracing experiments using fraeppli-nls embryos, inducing recombination by heat shock at 26 hpf to label hepatoblasts. At 120 hpf, embryos were screened by live imaging at the confocal microscope, and only sparsely labelled embryos were raised and fixed in either juvenile or adult stages. (C-H) Recombined livers showed different cluster topologies: clusters along central veins (C-C’) (n = 9 livers), proximal–distal stripes (D) (n = 23 livers) or giant clusters in the ventral lobe in adult (F-G’) (n = 3 livers). Large clusters in the ventral lobe can originate from one single-labelled cell at 5 dpf (n = 1 liver) (E). (F) Stereomicroscope image showing the spatial location of the giant clone originating from a single recombined cell (H). Recombined livers show a range of cluster sizes from small (H’) to medium (H”). (I) Schematics of characteristic cluster topologies in recombined livers. Red lines indicate the blood vessel orientation in the liver. (C-H) Total numbers are (N = 9, n = 79 livers). A, anterior; P, posterior; R, right; L, left; RL, right lobe; LL, left lobe; VL, ventral lobe.

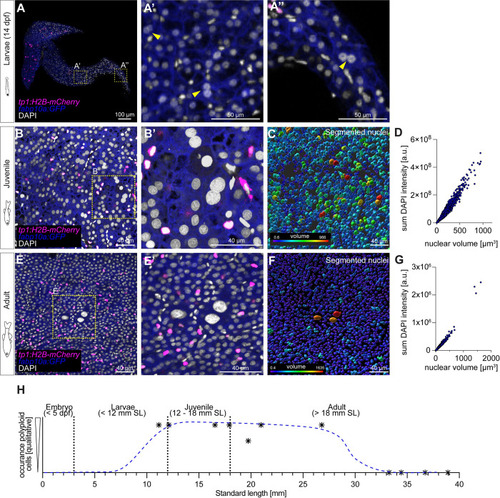
Polyploid cells appear transiently in hepatic postembryonic growth in zebrafish.

(A) Whole-mount of a 14-dpf zebrafish liver, displaying sparse multinucleated hepatocytes (N = 1, n = 2 livers; yellow arrowheads indicate binucleated cells). (B) Approximately 5 μm projection of a region of a juvenile liver. Fish SL = 11.16 mm (N = 3, n = 6 livers). (C) Segmentation shows variable nuclear volumes, which correlate with the sum intensity of DAPI, indicating that bigger nuclei have a higher amount of DNA (D). (E) Approximately 5 μm projection of an adult liver region (N = 3, n = 3 livers). (F) Segmented nuclei show only sparse variability in volume, with few bigger nuclei. Nuclear volume correlates with sum intensity of DAPI (G). (H) Schematics representing the transient appearance of polyploid cells over time; blue trajectory is manually approximated based on qualitative analysis. The numerical values that were used to generate the graphs in (D, G, H) can be found in S1 Data. DAPI, 4′,6-diamidino-2-phenylindole; dpf, day postfertilization; SL, standard length.

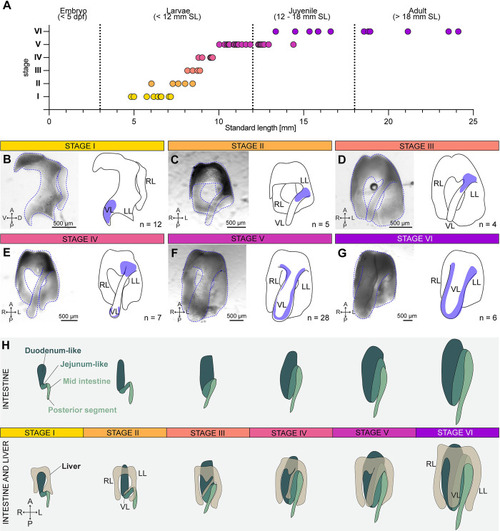
Ventral liver lobe formation during postembryonic growth.

(A) The 6 steps of ventral liver lobe formation correlate with fish standard length (SL). The numerical values that were used to generate the graph can be found in S1 Data. (B) Stage I: A small tissue extension at the tip of the left lobe is visible (n = 12 livers). (C) Stage II: a thin ventral lobe originates in the lower half of the left lobe (n = 6 livers). (D) Stage III: the thin ventral lobe shifts position towards the more anterior part of the left lobe (n = 4 livers). (E) Stage IV: the tip of the ventral lobe starts to expand (n = 7 livers). (F) Stage V: lateral-oriented expansion of the ventral lobe (n = 28 livers). (G) Stage VI: enlargement of all lobes in width (n = 6 livers). The blue areas in the schematics mark the region characteristic for the respective stage. (H) Schematic depicting the morphology of the liver in relation to the folding of the intestine in stages I-VI. A, anterior; P, posterior; R, right; L, left; RL, right lobe; LL, left lobe; VL, ventral lobe.

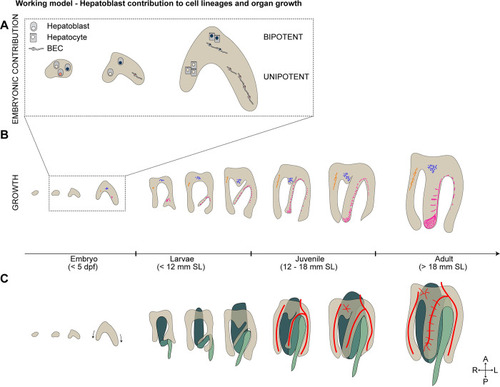
Working model of hepatoblast contribution to lineage decision and postembryonic growth.

Schematics showing the current working models: (A) uni- and bipotent hepatoblast contributions to hepatocytes and BECs following heterogeneous lineage decisions. (B) Hepatoblasts contribute with heterogeneous proliferation behaviours to postembryonic liver growth. Cells from the embryonic left lobe contribute to the ventral lobe, including the formation of giant clusters (magenta). (C) The liver morphology changes dramatically simultaneous to the intestinal bending occurring during postembryonic growth (green). BEC, biliary epithelial cell; dpf, day postfertilization; SL, standard length.

Acknowledgments
This image is the copyrighted work of the attributed author or publisher, and ZFIN has permission only to display this image to its users. Additional permissions should be obtained from the applicable author or publisher of the image. Full text @ PLoS Biol.