IMAGE

Fig 4

ID
ZDB-IMAGE-231005-6
Source
Figures for Unterweger et al., 2023
Image
Figure Caption

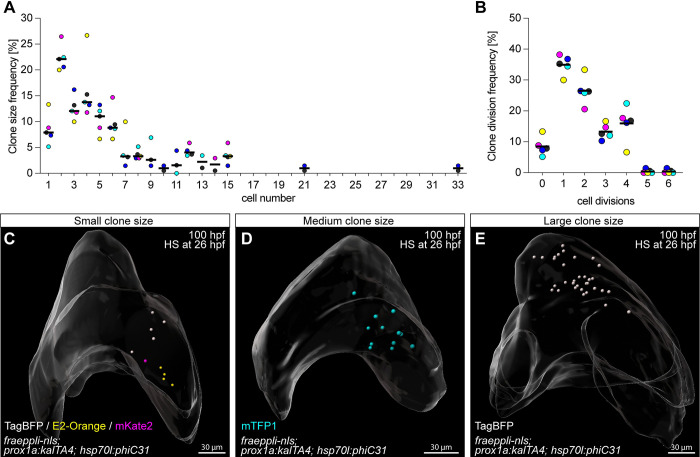
Fig 4 Quantitative lineage tracing of hepatoblasts during embryonic development identifies heterogeneous growth behaviour.

(A) Frequency of manually assigned pure hepatocyte clone sizes (N = 6, n = 190 clones). (B) Distribution of the corresponding number of cell divisions for each pure hepatocyte clone (N = 6, n = 190 clones). (A, B) Clone colours are plotted in blue (TagBFP), turquoise (mTFP1), magenta (mKate2), and orange (E2-Orange); the mean of all colours is represented in black. (C) Whole-mount of a 100-hpf liver showing several clones, including a mKate2+ 1-cell clone (N = 6, n = 15 livers). (D) Liver with a medium size 12-cell mTFP1+ clone (N = 6, n = 7 livers). (E) Whole-mount of a 100-hpf liver with a large 33-cell TagBFP+ clone (N = 1, n = 1 livers). (C-E) Labelled cells are represented as segmented nuclei, and an overall segmentation of the whole liver tissue is shown in transparent grey. The numerical values that were used to generate the graphs in (A, B) can be found in S1 Data.

Acknowledgments
This image is the copyrighted work of the attributed author or publisher, and ZFIN has permission only to display this image to its users. Additional permissions should be obtained from the applicable author or publisher of the image. Full text @ PLoS Biol.