FIGURE

Fig 2

ID
ZDB-FIG-231005-8
Publication
Unterweger et al., 2023 - Lineage tracing identifies heterogeneous hepatoblast contribution to cell lineages and postembryonic organ growth dynamics
Other Figures
All Figure Page
Back to All Figure Page
Fig 2

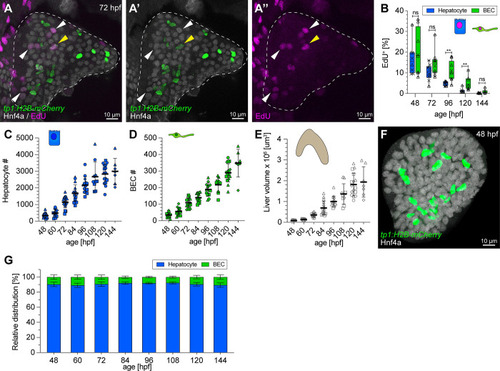
Hepatic proliferation dynamics and early establishment of a 1:9 BEC:hepatocyte ratio during embryonic development.

(A) Approximately 5 μm projection of a 72-hpf liver expressing tp1:H2B-mCherry (BEC), stained for Hnf4a (hepatocytes) and EdU (proliferating cells). Yellow and white arrowheads highlight proliferating BECs and hepatocytes, respectively (N = 2, n = 10 livers). (B) Graph showing the proportion of EdU+ proliferating hepatocytes and BECs over time (N = 2, n ≥ 8). (C, D) Graph showing hepatocyte (C) and BEC (D) cell numbers during development (N = 4, n ≥ 12 livers). (E) Quantification of total liver volume during development determined in embryos in BABB (N = 4, n ≥ 12 livers). (F) Maximum projection (20 μm z-stacks) of a 48-hpf liver expressing tp1:H2B-mCherry (BEC) and stained for Hnf4ɑ (hepatocyte). (G) Relative distribution of BECs and hepatocytes during development from 48 to 144 hpf (N = 4, n ≥ 12 livers). (B-E) Different shape data points indicate different experiments. The numerical values that were used to generate the graphs in (B-E, G) can be found in S1 Data. BEC, biliary epithelial cell; EdU, 5-ethynyl-2′-deoxyuridine; hpf, hours post fertilization.

Expression Data

Expression Detail
Antibody Labeling
Phenotype Data

Phenotype Detail
Acknowledgments
This image is the copyrighted work of the attributed author or publisher, and ZFIN has permission only to display this image to its users. Additional permissions should be obtained from the applicable author or publisher of the image. Full text @ PLoS Biol.