FIGURE

Fig 1

ID
ZDB-FIG-231005-7
Publication
Unterweger et al., 2023 - Lineage tracing identifies heterogeneous hepatoblast contribution to cell lineages and postembryonic organ growth dynamics
Other Figures
All Figure Page
Back to All Figure Page
Fig 1

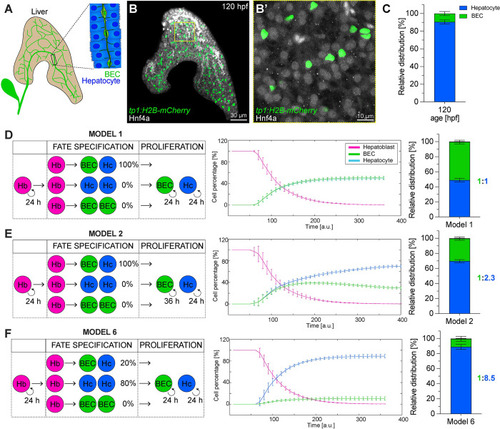
Establishment of BEC and hepatocyte lineages: in vivo cell type quantification and in silico modelling

(A) Schematic of a 5-dpf liver, highlighting the biliary network. (B-B’) Maximum projection (200 μm z-stack) of a 120-hpf liver expressing tp1:H2B-mCherry (BEC) and stained for Hnf4ɑ (hepatocyte). Autofluorescent blood cells appear in bright white. (N = 4, n ≥ 12 livers) (C) Relative distribution of BECs and hepatocytes at 120 hpf (N = 4, n ≥ 12 livers). (D-F) Mathematical models simulating hepatoblast differentiation employing different parameter combinations: proliferation rates of differentiated cell types is equal (D, F) or slower in BECs (E). Hepatoblasts either are all bipotent (D, E) or represent a heterogeneous population with mixed probabilities for uni-or bipotent differentiation (F). Plots showing the simulated cell proportions over simulation time (n = 10) and the final cell type ratio in bar graphs. The numerical values that were used to generate the graphs in (C-F) can be found in S1 Data. BEC, biliary epithelial cell; dpf, day postfertilization; Hb, hepatoblast; Hc, hepatocyte; hpf, hours post fertilization.

Expression Data

Expression Detail
Antibody Labeling
Phenotype Data

Phenotype Detail
Acknowledgments
This image is the copyrighted work of the attributed author or publisher, and ZFIN has permission only to display this image to its users. Additional permissions should be obtained from the applicable author or publisher of the image. Full text @ PLoS Biol.