|
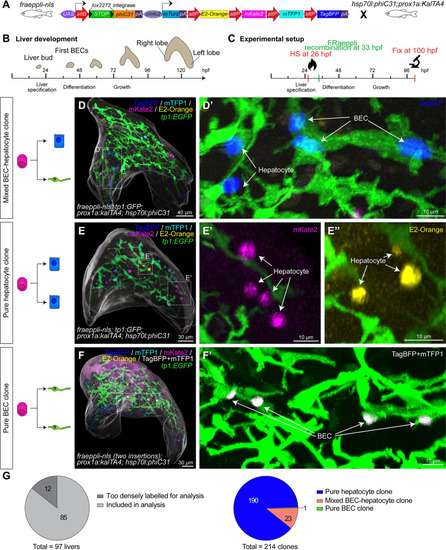
Quantitative lineage tracing identifies uni- and bipotent hepatoblast contributions during lineage decisions. (A) Schematic of FRaeppli-NLS cassette including attB and attP sites for PhiC31-mediated recombination and the 4 FRaeppli FPs: TagBFP, mTFP1, mKate2, and E2-Orange. Recombination is induced by combining fraeppli-nls with hsp70l:phiC31; prox1a:kalTA4; see S3A Fig. (B) Key steps of liver development in zebrafish: After hepatoblast specification, the differentiation into BECs and hepatocytes is initiated at around 42 hpf. Differentiated cells acquire polarity and form a functional architecture by 120 hpf. (C) Experimental strategy for tracing progeny of individual hepatoblasts using fraeppli-nls: Heat shock at 26 hpf controls PhiC31 expression followed by attB-attP recombination. Embryos were fixed at 100 hpf for analysis. (D-F) Whole-mount livers at 100 hpf showing (D) mixed clone composed of hepatocytes and BECs (D’) (N = 6, n = 23 clones); (E) clones formed by pure hepatocytes (E’-E”) (N = 6, n = 190 clones); and (F) example of pure BEC clone coexpressing TagBFP and mTFP1 (white, coexpressing cells were manually segmented and masked). (F’) (N = 2, n = 2 clones). (D-F) An overall segmentation of the whole liver tissue is shown in transparent grey. (G) Pie charts showing the total number of labelled embryos and clones with manually assigned lineage contributions (N = 6, n = 214 clones; in 2 of the 6 experiments, nuclear shape indicated BEC fate). The numerical values that were used to generate the graphs in (G) can be found in S1 Data. BEC, biliary epithelial cell; FP, fluorescent protein; hpf, hours post fertilization.
|