IMAGE

Fig 6

ID
ZDB-IMAGE-231005-8
Source
Figures for Unterweger et al., 2023
Image
Figure Caption

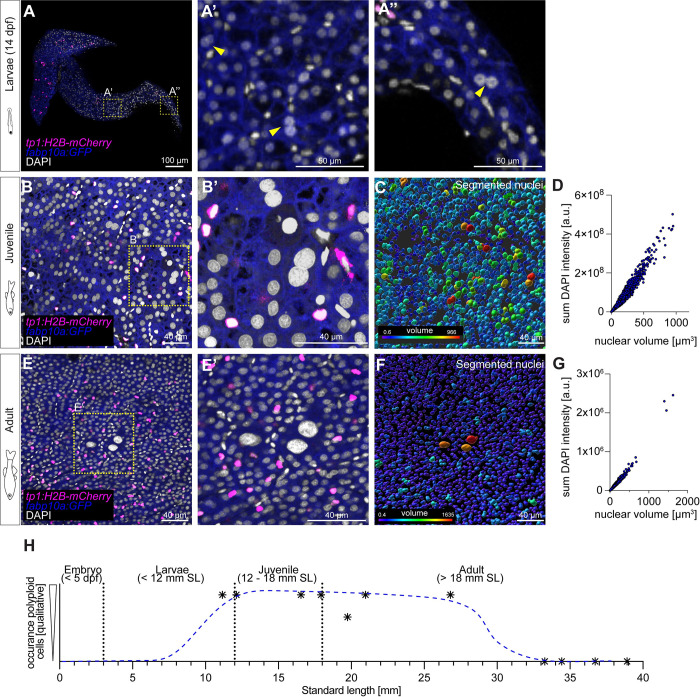
Fig 6 Polyploid cells appear transiently in hepatic postembryonic growth in zebrafish.

(A) Whole-mount of a 14-dpf zebrafish liver, displaying sparse multinucleated hepatocytes (N = 1, n = 2 livers; yellow arrowheads indicate binucleated cells). (B) Approximately 5 μm projection of a region of a juvenile liver. Fish SL = 11.16 mm (N = 3, n = 6 livers). (C) Segmentation shows variable nuclear volumes, which correlate with the sum intensity of DAPI, indicating that bigger nuclei have a higher amount of DNA (D). (E) Approximately 5 μm projection of an adult liver region (N = 3, n = 3 livers). (F) Segmented nuclei show only sparse variability in volume, with few bigger nuclei. Nuclear volume correlates with sum intensity of DAPI (G). (H) Schematics representing the transient appearance of polyploid cells over time; blue trajectory is manually approximated based on qualitative analysis. The numerical values that were used to generate the graphs in (D, G, H) can be found in S1 Data. DAPI, 4′,6-diamidino-2-phenylindole; dpf, day postfertilization; SL, standard length.

Acknowledgments
This image is the copyrighted work of the attributed author or publisher, and ZFIN has permission only to display this image to its users. Additional permissions should be obtained from the applicable author or publisher of the image. Full text @ PLoS Biol.