IMAGE

Fig 5

ID
ZDB-IMAGE-231005-7
Source
Figures for Unterweger et al., 2023
Image
Figure Caption

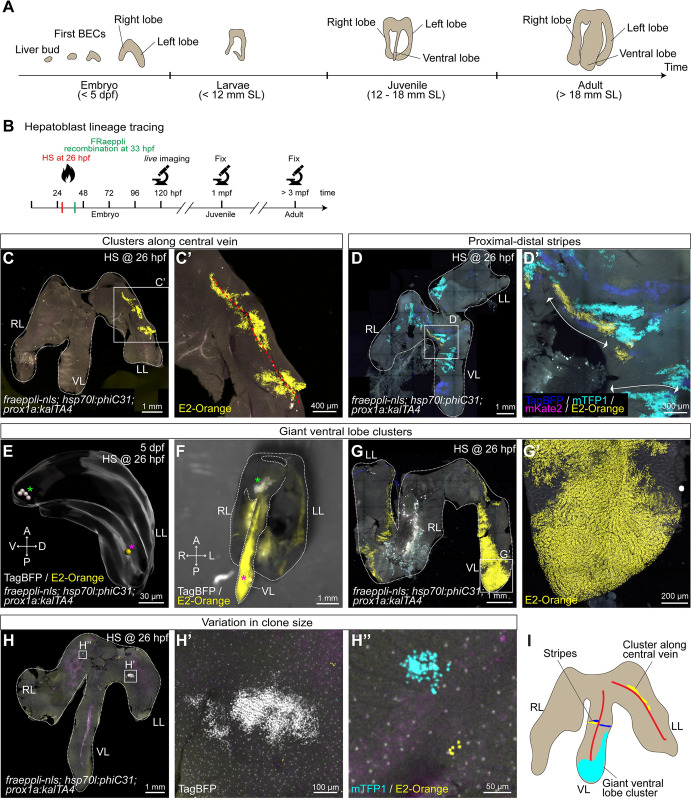
Fig 5 Lineage tracing reveals heterogeneous cluster topologies during postembryonic growth.

(A) Schematic depicting key stages in postembryonic zebrafish liver development. (B) Experimental schematics of long-term lineage tracing experiments using fraeppli-nls embryos, inducing recombination by heat shock at 26 hpf to label hepatoblasts. At 120 hpf, embryos were screened by live imaging at the confocal microscope, and only sparsely labelled embryos were raised and fixed in either juvenile or adult stages. (C-H) Recombined livers showed different cluster topologies: clusters along central veins (C-C’) (n = 9 livers), proximal–distal stripes (D) (n = 23 livers) or giant clusters in the ventral lobe in adult (F-G’) (n = 3 livers). Large clusters in the ventral lobe can originate from one single-labelled cell at 5 dpf (n = 1 liver) (E). (F) Stereomicroscope image showing the spatial location of the giant clone originating from a single recombined cell (H). Recombined livers show a range of cluster sizes from small (H’) to medium (H”). (I) Schematics of characteristic cluster topologies in recombined livers. Red lines indicate the blood vessel orientation in the liver. (C-H) Total numbers are (N = 9, n = 79 livers). A, anterior; P, posterior; R, right; L, left; RL, right lobe; LL, left lobe; VL, ventral lobe.

Acknowledgments
This image is the copyrighted work of the attributed author or publisher, and ZFIN has permission only to display this image to its users. Additional permissions should be obtained from the applicable author or publisher of the image. Full text @ PLoS Biol.