
- Title
-
An improved Erk biosensor detects oscillatory Erk dynamics driven by mitotic erasure during early development
- Authors
- Wilcockson, S.G., Guglielmi, L., Araguas Rodriguez, P., Amoyel, M., Hill, C.S.
- Source
- Full text @ Dev. Cell

Off-target Erk-KTR activity in the early zebrafish embryo (A) Schematic of the Erk-KTR construct showing the N-terminal Erk-docking domain derived from ELK1, a nuclear localization sequence (NLS) containing Erk-consensus phosphorylation sites (P), a nuclear export sequence (NES) and a C-terminal fluorescent protein, Clover. (B) Live images of an NIH-3T3 cell transfected with (C) Combined immunofluorescence and RNAscope showing diphosphorylated Erk (P-Erk) and (D) Stills of live (E) Schematic cross-section of the embryonic margin showing the relative position of the deep cells (DCs), the enveloping layer (EVL) and the yolk syncytial layer (YSL). (F) Single Scale bars, 25 μm (B), 50 μm (F), or 100 μm (C and D). |
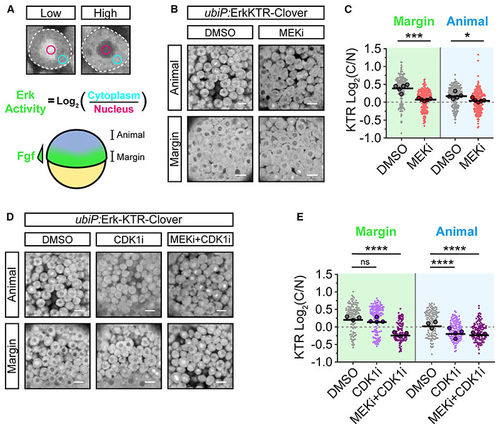
Erk-KTR reports on Erk and Cdk1 activity in early zebrafish embryos (A) Illustration of the method used to report Erk-KTR activity in early zebrafish embryos (schematized below) by measuring mean fluorescence intensity in a region of the nucleus (magenta) and cytoplasm (cyan). The margin of the embryo exhibits high Fgf signaling, while the animal pole does not. (B) Live imaging of (C) Quantification of Erk-KTR activity in (B) at the margin (***p = 0.0002) and animally(*p = 0.0207). n = 178–209 cells per condition from 5 embryos. Shown arethe single-cell readouts of Erk-KTR activity overlayed with the per embryo averages and the overall mean. (D) As in (B) but following treatment with DMSO (control), 20 μM RO-3306 (CDK1i), or both 10 μM PD-0325901 and 20 μM RO-3306 (MEKi + CDK1i) for 1 h from 4.0 hpf. (E) Quantification of Erk-KTR activity in (D) as in (C) for CDK1i (margin p = 0.3131; animal p < 0.0001) or both MEKi and CDK1i (margin p < 0.0001; animal p < 0.0001). n = 107–146 cells per condition from 3 (DMSO and MEKi + CDK1i) or 4 embryos (CDK1i) per condition. Statistical tests were Student t test (C) or one-way ANOVA with Sidak’s multiple comparisons test (E). Scale bars, 20 μm; **** p < 0.0001; ns, not significant. |
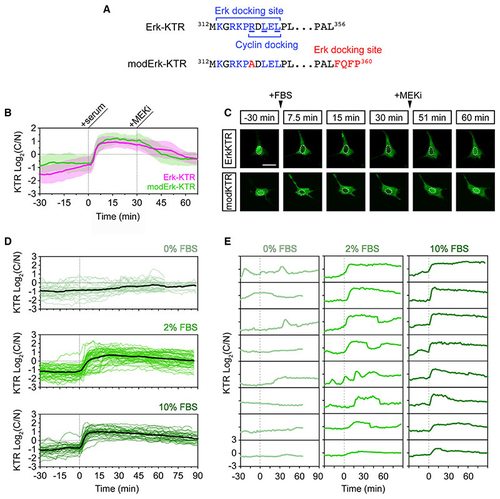
A modified Erk-KTR reports ERK activity in mouse fibroblasts (A) Amino acid sequences of the Erk-docking domain of Erk-KTR and modified Erk-KTR (modErk-KTR) highlighting the modifications (red) made to reduce off-target reporter activity, including the R>A substitution within the docking site and the additional FQFP Erk-docking site between the ELK fragment and the NLS. (B) Quantification of ERK activity in NIH-3T3 cells transfected with the Erk-KTR or modErk-KTR constructs (n = 58 cells each, mean ± SD). Cells were serum-starved overnight and ERK was induced by the addition of 10% FBS. ERK activity was inhibited after 30 min with 10 μM PD-0325901 (MEKi). (C) Representative images of reporter activity in (B). (D) Quantification of ERK activity in NIH-3T3 cells transfected with the modErk-KTR construct after overnight serum starvation, followed by the addition of different concentrations of FBS. Individual cell traces and the mean (black line) are shown for 0% FBS (n = 32 cells), 2% FBS (n = 57 cells), and 10% FBS (n = 30 cells). (E) Individual cell traces from (D). Scale bars, 20 μM. |
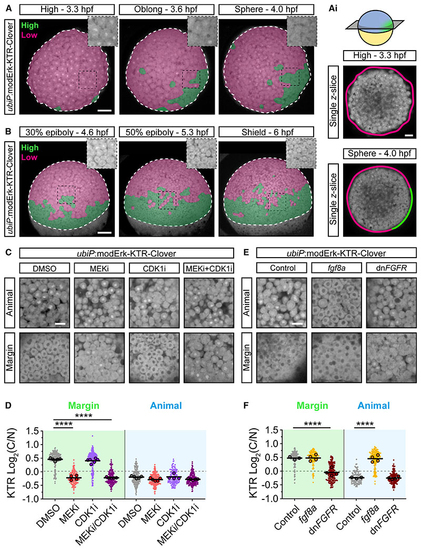
modErk-KTR specifically reports on Fgf/Erk activity in early zebrafish embryos (A and B) Stills of live (Ai) Single (C) Live imaging of (D) Quantification of Erk activity in (C) at the margin and animally. Shown are the single-cell readouts of Erk activity overlayed with the per embryo averages and the overall mean for DMSO (control, n = 209 cells from 5 embryos [margin] or n = 200 cells from 5 embryos [animal]), 10 μM PD-0325901 (MEKi; n = 137 cells from 4 embryos [margin] or n = 196 from 5 embryos [animal]), 20 μM RO-3306 (CDK1i; n = 227 cells from 6 embryos [margin] or n = 133 cells from 4 embryos [animal]) or both 10 μM PD-0325901 and 20 μM RO-3306 (MEKi + CDK1i; n = 183 cells from 5 embryos [margin] or n = 194 cells from 5 embryos [animal]) treated embryos. (E) Live imaging as in (C) of embryos injected with either 25 pg (F) Quantification of Erk activity in (E) as in (D) for control (n = 142 cells from 3 embryos [margin] and n = 116 cells from 3 embryos [animal]), Statistical tests were one-way ANOVA with Šidák’s multiple comparisons test. Scale bars, 100 μm (A and B), 50 μm (Ai) or 20 μm (C–E); **** p > 0.0001. See also |
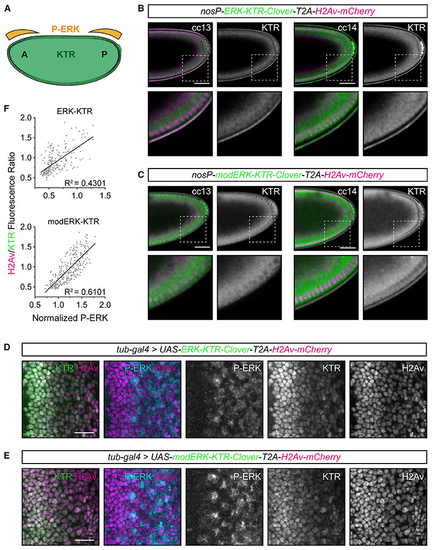
Improved Erk activity reporting with modERK-KTR in (A) Schematic of anteroposterior Torso/ERK signaling during early (B and C) Representative images of the posterior half of transgenic (D and E) Representative images of eye imaginal discs ubiquitously expressing ERK-KTR (D) or modERK-KTR (E) constructs with a polycistronic H2Av-mCherry tag under the control of (F) Quantification of (D) and (E) comparing P-ERK levels with the read out of ERK-KTR (n = 222 cells from 3 discs) or modERK-KTR (n = 293 cells from 3 discs) constructs and fitted with a simple linear regression. See also |
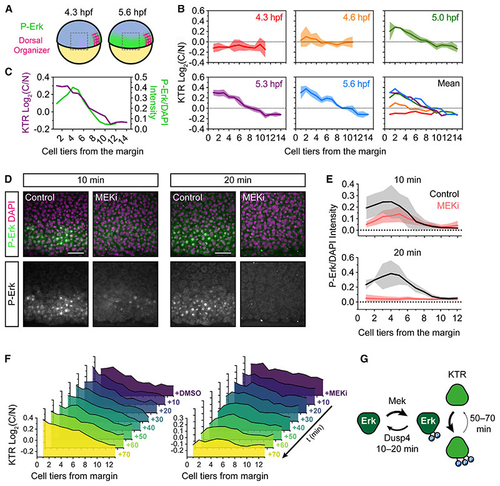
modERK-KTR reads out Fgf/Erk signaling gradient formation in real time (A) Schematic of the zebrafish embryo illustrating the lateral region imaged in (B) relative to the dorsal organizer (see (B) Quantification of Erk activity (log2(C/N)) in the lateral region of (C) Overlay of the mean Erk activity (modErk-KTR) and P-Erk levels in similarly staged embryos (5.3 hpf). (D) Representative immunofluorescence images of embryos treated with DMSO (control) or MEKi (10 μM PD-0325901) for 10–20 min from 5.0 hpf before fixation. (E) Quantification of P-Erk levels from (D) in cell tiers relative to the embryo margin (0) showing mean ± SD. DMSO 10 min, 5 embryos; MEKi 10 min, n = 6 embryos; DMSO 20 min, n = 4 embryos; MEKi 20 min, n = 4 embryos. (F) Quantification of modErk-KTR read out following treatment with DMSO (control) or 10 μM PD-0325901 (MEKi). Shown is the mean of n = 3 embryos per time point. (G) Schematic comparing the dephosphorylation rates of Erk and its targets. Scale bars, 50 μm. See also |
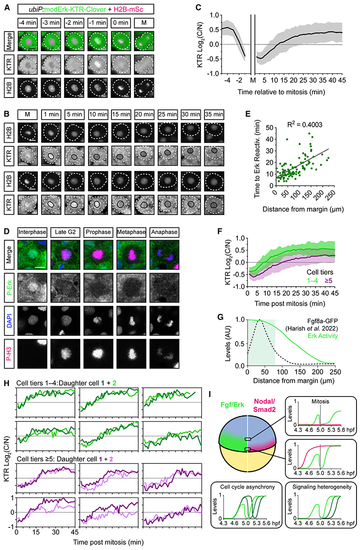
Mitotic erasure induces oscillatory Fgf/Erk signaling dynamics in the presumptive mesendoderm (A) Representative images of a single mesendodermal cell approaching mitosis. (B) As in (A) following two cells post-mitosis. Black line labels the nucleus. (C) Quantification of Erk activityfrom (A) and (B) following mother cells (n = 56 cells) from −5 min before mitosis and daughter cells (n = 110) +45 min after mitosis showing mean ± SD. Nuclear envelope breakdown means the KTR cannot read out Erk activity during mitosis itself. (D) Representative immunofluorescence images of P-Erk and P-H3 in zebrafish embryos (4.6 hpf). (E) Quantification of the time to Erk reactivation (log2(C/N) ≥ 0.25) post-mitosis and the distance of each cell from the embryonic margin (n = 110) and fitted with a simple linear regression. (F) Comparison of Erk reactivation rates from (C) with cells binned based on their initial distance from the margin. (G) Schematic of the Erk activity gradient, as read out by modErk-KTR, and the extracellular levels of Fgf8a-GFP described in similarly staged embryos (~5.3 hpf). (H) Single-cell traces of sister cells post-mitosis from (E). (I) Model depicting how mitotic erasure of P-Erk and its target proteins induces signaling oscillations. Both the rate of reactivation post-mitosis and the final amplitude of Erk activity are sensitive to a cell’s relative position within the Fgf signaling gradient. Coupled with cell cycle asynchrony and variability in reactivation rates, mitotic erasure introduces heterogeneity to Fgf/Erk signaling in the presumptive mesendoderm. Different green lines correspond to P-Erk levels in different cells. Scale bars, 10 μm. See also |
Reprinted from Developmental Cell, 58(23), Wilcockson, S.G., Guglielmi, L., Araguas Rodriguez, P., Amoyel, M., Hill, C.S., An improved Erk biosensor detects oscillatory Erk dynamics driven by mitotic erasure during early development, 2802-2818.e5, Copyright (2023) with permission from Elsevier. Full text @ Dev. Cell